Comprehensive Annual Financial Report for the ... - WMATA.com
Comprehensive Annual Financial Report for the ... - WMATA.com
Comprehensive Annual Financial Report for the ... - WMATA.com
- No tags were found...
You also want an ePaper? Increase the reach of your titles
YUMPU automatically turns print PDFs into web optimized ePapers that Google loves.
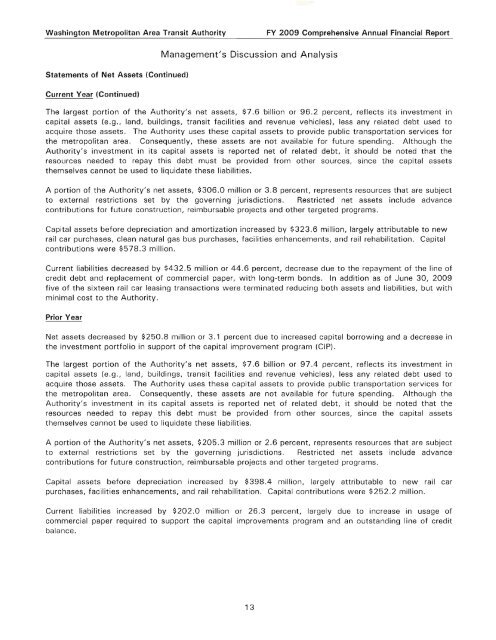
Washington Metropolitan Area Transit AuthorityFY 2009 <strong>Comprehensive</strong> <strong>Annual</strong> <strong>Financial</strong> <strong>Report</strong>Statements of Net Assets (Continued)Current Year (Continued)Management's Discussion and AnalysisThe largest portion of <strong>the</strong> Authority's net assets, $7.6 billion or 96.2 percent, reflects its investment incapital assets (e.g., land, buildings, transit facilities and revenue vehicles), less any related debt used toacquire those assets. The Authority uses <strong>the</strong>se capital assets to provide public transportation services <strong>for</strong><strong>the</strong> metropolitan area. Consequently, <strong>the</strong>se assets are not available <strong>for</strong> future spending. Although <strong>the</strong>Authority's investment in its capital assets is reported net of related debt, it should be noted that <strong>the</strong>resources needed to repay this debt must be provided from o<strong>the</strong>r sources, since <strong>the</strong> capital assets<strong>the</strong>mselves cannot be used to liquidate <strong>the</strong>se liabilities.A portion of <strong>the</strong> Authority's net assets, $306.0 million or 3.8 percent, represents resources that are subjectto external restrictions set by <strong>the</strong> governing jurisdictions. Restricted net assets include advancecontributions <strong>for</strong> future construction, reimbursable projects and o<strong>the</strong>r targeted programs.Capital assets be<strong>for</strong>e depreciation and amortization increased by $323.6 million, largely attributable to newrail car purchases, clean natural gas bus purchases, facilities enhancements, and rail rehabilitation. Capitalcontributions were $578.3 million.Current liabilities decreased by $432.5 million or 44.6 percent, decrease due to <strong>the</strong> repayment of <strong>the</strong> line ofcredit debt and replacement of <strong>com</strong>mercial paper, with long-term bonds. In addition as of June 30, 2009five of <strong>the</strong> sixteen rail car leasing transactions were terminated reducing both assets and liabilities, but withminimal cost to <strong>the</strong> Authority.Prior YearNet assets decreased by $250.8 million or 3.1 percent due to increased capital borrowing and a decrease in<strong>the</strong> investment portfolio in support of <strong>the</strong> capital improvement program (CIP).The largest portion of <strong>the</strong> Authority's net assets, $7.6 billion or 97.4 percent, reflects its investment incapital assets (e.g., land, buildings, transit facilities and revenue vehicles), less any related debt used toacquire those assets. The Authority uses <strong>the</strong>se capital assets to provide public transportation services <strong>for</strong><strong>the</strong> metropolitan area. Consequently, <strong>the</strong>se assets are not available <strong>for</strong> future spending. Although <strong>the</strong>Authority's investment in its capital assets is reported net of related debt, it should be noted that <strong>the</strong>resources needed to repay this debt must be provided from o<strong>the</strong>r sources, since <strong>the</strong> capital assets<strong>the</strong>mselves cannot be used to liquidate <strong>the</strong>se liabilities.A portion of <strong>the</strong> Authority's net assets, $205.3 million or 2.6 percent, represents resources that are subjectto external restrictions set by <strong>the</strong> governing jurisdictions. Restricted net assets include advancecontributions <strong>for</strong> future construction, reimbursable projects and o<strong>the</strong>r targeted programs.Capital assets be<strong>for</strong>e depreciation increased by $398.4 million, largely attributable to new rail carpurchases, facilities enhancements, and rail rehabilitation. Capital contributions were $252.2 million.Current liabilities increased by $202.0 million or 26.3 percent, largely due to increase in usage of<strong>com</strong>mercial paper required to support <strong>the</strong> capital improvements program and an outstanding line of creditbalance.13


