- Page 1 and 2:
Report to Shareholders 2006growbeyo
- Page 3 and 4:
In 2006, Keppel Land delivered ongr
- Page 5 and 6:
Group quarterly resultsQuarter 1 Qu
- Page 7 and 8:
Dear Shareholders,On behalf of the
- Page 9 and 10:
As appreciation of the waterfront l
- Page 11 and 12:
Keppel Land was also awarded the Be
- Page 13 and 14:
Depth and breadth...in execution en
- Page 16 and 17:
scaling heightsFinancial discipline
- Page 19 and 20:
deepening insightsDepth and breadth
- Page 21:
Meeting demand for quality housing
- Page 24 and 25:
oadening reachSpring City Golf & La
- Page 26 and 27:
Group at a glanceKeppel Land Busine
- Page 28 and 29:
Board of directorsA strong Board of
- Page 30 and 31:
Board of directorsTan Yam Pin, 66Ch
- Page 32 and 33:
Board of directorsLim Chee Onn, 62M
- Page 34 and 35:
Board of directorsNiam Chiang Meng,
- Page 36 and 37:
Senior managementFrom left to right
- Page 38 and 39:
Senior managementChoo Chin Teck, 62
- Page 40 and 41: Profile of directors and seniormana
- Page 42 and 43: Key personnelKeppel Land LimitedLim
- Page 44 and 45: Key personnelKeppel Bay Pte LtdTan
- Page 46 and 47: Corporate governanceCommitment to h
- Page 48 and 49: Corporate governanceThe Directors
- Page 50 and 51: Corporate governanceThe Directors s
- Page 52 and 53: Corporate governanceNo member of th
- Page 54 and 55: Corporate governanceCompany’s sha
- Page 56 and 57: Corporate governanceEach item of sp
- Page 58 and 59: Investor relationsInvestors’ inte
- Page 60 and 61: Investor relationsKeppel Land conti
- Page 62 and 63: Awards and accoladesRecognition gar
- Page 64 and 65: Special feature
- Page 66 and 67: Special featureWaterfront homes - L
- Page 68 and 69: Special featureWaterfront homes - L
- Page 70 and 71: Special featureWaterfront homes - L
- Page 72 and 73: Special featureWaterfront homes - L
- Page 74 and 75: Key figures at a glanceSuccessful e
- Page 76 and 77: Financial reviewOverview2006 2005 %
- Page 78 and 79: Financial reviewSources of finance$
- Page 80 and 81: Financial reviewAttributable profit
- Page 82 and 83: Property portfolio analysisAnalysis
- Page 84 and 85: Value added statementBy segmentHosp
- Page 86 and 87: Productivity analysisIn 2006, the t
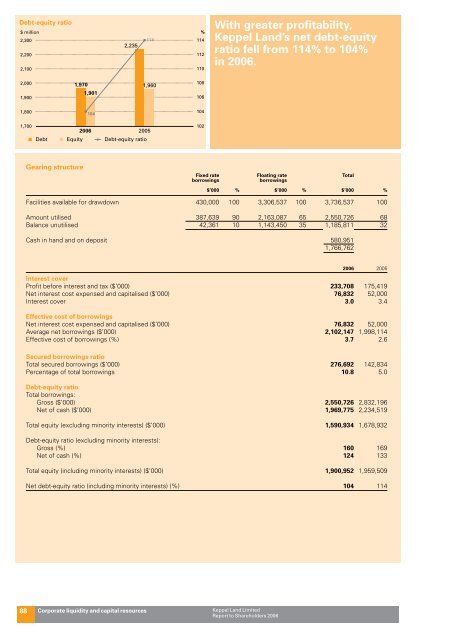
- Page 88 and 89: Economic value addedYear-on-year ch
- Page 92 and 93: Risk managementIdentifying and mana
- Page 94 and 95: Business dynamics andrisk factorsTh
- Page 96 and 97: Critical accounting policies and re
- Page 98 and 99: Significant events3 4June• Keppel
- Page 100 and 101: Operations and market reviewSingapo
- Page 102 and 103: Operations and market reviewSingapo
- Page 104 and 105: Reflections Keppel Bay, at Singapor
- Page 106 and 107: Operations and market reviewUrbana
- Page 108 and 109: Operations and market reviewSingapo
- Page 110 and 111: Operations and market reviewSingapo
- Page 112 and 113: Operations and market reviewSingapo
- Page 114 and 115: Operations and market reviewSingapo
- Page 116 and 117: established with the foresight of s
- Page 118 and 119: Operations and market reviewMarket
- Page 120 and 121: Operations and market reviewSingapo
- Page 122 and 123: Operations and market reviewSingapo
- Page 124: Operations and market reviewOversea
- Page 127 and 128: China’s housing market willgrow f
- Page 129 and 130: Spring City Golf & Lake Resort, Kun
- Page 131 and 132: The Arcadia, TianjinBy end-2006, 10
- Page 133 and 134: The expansion of foreign companies,
- Page 135 and 136: Elita HorizonElita Horizon is the s
- Page 137 and 138: Operations and market reviewVietnam
- Page 139 and 140: Villa Riviera, Ho Chi Minh CityMark
- Page 141 and 142:
Operations and market reviewIndones
- Page 143 and 144:
BG Junction, SurabayaSurabayaBG Jun
- Page 145 and 146:
Better economic outlook andrenewed
- Page 147 and 148:
Operations and market reviewPhilipp
- Page 149 and 150:
Operations and market reviewThailan
- Page 151 and 152:
52 Hong KongINDIAKolkata 55MYANMAR7
- Page 154 and 155:
People reviewExecutiveNon-executive
- Page 156 and 157:
Annual Dinner and Dance 2006Synergy
- Page 158 and 159:
Corporate and social responsibility
- Page 160 and 161:
Corporate and social responsibility
- Page 162 and 163:
Villa Arcadia at Srinakarin, Thaila
- Page 164 and 165:
Corporate and social responsibility
- Page 166 and 167:
Statutory report and accounts
- Page 168 and 169:
At 1.1.06 or Dateof Appointment At
- Page 170 and 171:
(c)The information on Directors of
- Page 172 and 173:
Statement by directorsFor the finan
- Page 174 and 175:
Consolidated profit and loss accoun
- Page 176 and 177:
Consolidated statement of changes i
- Page 178 and 179:
Company statement of changes in equ
- Page 180 and 181:
2006 2005$’000 $’000Represented
- Page 182 and 183:
Revenue RecognitionThe Group recogn
- Page 184 and 185:
(g)Fixed AssetsFixed assets are sta
- Page 186 and 187:
(iii)Available-For-Sale Financial A
- Page 188 and 189:
(t)Revenue RecognitionRental and re
- Page 190 and 191:
Notes to the financial statementsFo
- Page 192 and 193:
4. Interest and Investment IncomeGr
- Page 194 and 195:
A reconciliation between the tax ex
- Page 196 and 197:
9. Earnings per ShareGroup2006 2005
- Page 198 and 199:
(d)On 8 February 2006 and 10 August
- Page 200 and 201:
12. Long-term BorrowingsGroupCompan
- Page 202 and 203:
13. Fixed AssetsLand and Buildings
- Page 204 and 205:
14. Investment PropertiesGroupLand
- Page 206 and 207:
17. Associated CompaniesGroupCompan
- Page 208 and 209:
21. DebtorsGroupCompany2006 2005 20
- Page 210 and 211:
Advances to related companies are i
- Page 212 and 213:
Secured bank borrowing bears a fixe
- Page 214 and 215:
(c) By Geographical Location - 2005
- Page 216 and 217:
29. Significant Related Party Trans
- Page 218 and 219:
32. Financial Reporting Standards (
- Page 220 and 221:
Significant subsidiary and associat
- Page 222 and 223:
Country ofEffectiveIncorporation/Eq
- Page 224 and 225:
Country ofEffectiveIncorporation/Eq
- Page 226 and 227:
Corporate informationBoard of Direc
- Page 228 and 229:
Corporate structure100%Keppel Land
- Page 230 and 231:
Property portfolioGroup Properties
- Page 232 and 233:
Group Properties (Singapore) (cont
- Page 234 and 235:
Group Properties (Overseas)Descript
- Page 236 and 237:
Group Properties (Overseas) (cont
- Page 238 and 239:
Group Properties (Overseas) (cont
- Page 240 and 241:
Group Properties (Overseas) (cont
- Page 242 and 243:
Group Properties (Overseas) (cont
- Page 244 and 245:
Statistics of shareholdingsAs at 1
- Page 246 and 247:
Notice of annual general meeting an
- Page 248 and 249:
(2) unless varied or revoked by the
- Page 250 and 251:
Share transaction statisticsCompara
- Page 252 and 253:
Fold and glue along dotted lineProx
- Page 254:
Keppel Land Limited(Incorporated in