Vol 39 # 2 June 2007 - Kma.org.kw
Vol 39 # 2 June 2007 - Kma.org.kw
Vol 39 # 2 June 2007 - Kma.org.kw
- No tags were found...

Create successful ePaper yourself
Turn your PDF publications into a flip-book with our unique Google optimized e-Paper software.
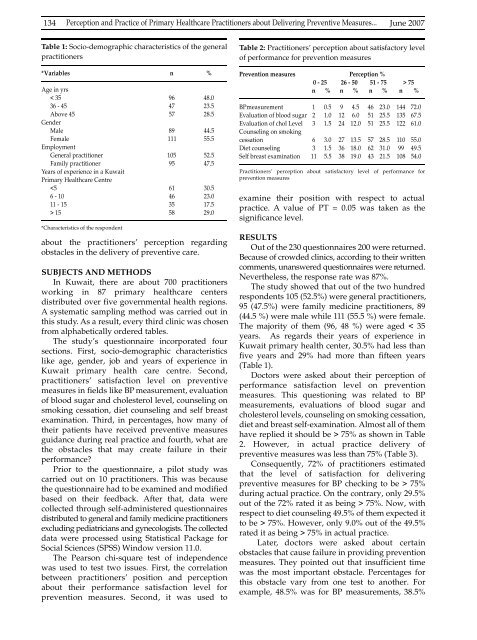
134Perception and Practice of Primary Healthcare Practitioners about Delivering Preventive Measures... <strong>June</strong> <strong>2007</strong>Table 1: Socio-demographic characteristics of the generalpractitioners*Variables n %Age in yrs< 35 96 48.036 - 45 47 23.5Above 45 57 28.5GenderMale 89 44.5Female 111 55.5EmploymentGeneral practitioner 105 52.5Family practitioner 95 47.5Years of experience in a KuwaitPrimary Healthcare Centre 15 58 29.0*Characteristics of the respondentabout the practitioners’ perception re g a rd i n gobstacles in the delivery of preventive care.SUBJECTS AND METHODSIn Kuwait, there are about 700 practitionersworking in 87 primary healthcare centersdistributed over five governmental health regions.A systematic sampling method was carried out inthis study. As a result, every third clinic was chosenfrom alphabetically ordered tables.The study’s questionnaire incorporated foursections. First, socio-demographic characteristicslike age, gender, job and years of experience inKuwait primary health care centre. Second,practitioners’ satisfaction level on pre v e n t i v emeasures in fields like BP measurement, evaluationof blood sugar and cholesterol level, counseling onsmoking cessation, diet counseling and self breastexamination. Third, in percentages, how many oftheir patients have received preventive measuresguidance during real practice and fourth, what arethe obstacles that may create failure in theirperformance?Prior to the questionnaire, a pilot study wascarried out on 10 practitioners. This was becausethe questionnaire had to be examined and modifiedbased on their feedback. After that, data werecollected through self-administered questionnairesdistributed to general and family medicine practitionersexcluding pediatricians and gynecologists. The collecteddata were processed using Statistical Package forSocial Sciences (SPSS) Window version 11.0.The Pearson chi-square test of independencewas used to test two issues. First, the correlationbetween practitioners’ position and perc e p t i o nabout their performance satisfaction level forp revention measures. Second, it was used toTable 2: Practitioners’ perception about satisfactory levelof performance for prevention measuresPrevention measures Perception %0 - 25 26 - 50 51 - 75 > 75n % n % n % n %BPmeasurement 1 0.5 9 4.5 46 23.0 144 72.0Evaluation of blood sugar 2 1.0 12 6.0 51 25.5 135 67.5Evaluation of chol Level 3 1.5 24 12.0 51 25.5 122 61.0Counseling on smokingcessation 6 3.0 27 13.5 57 28.5 110 55.0Diet counseling 3 1.5 36 18.0 62 31.0 99 49.5Self breast examination 11 5.5 38 19.0 43 21.5 108 54.0Practitioners’ perception about satisfactory level of performance forprevention measuresexamine their position with respect to actualpractice. A value of PT = 0.05 was taken as thesignificance level.RESULTSOut of the 230 questionnaires 200 were returned.Because of crowded clinics, according to their writtencomments, unanswered questionnaires were re t u r n e d .Nevertheless, the response rate was 87%.The study showed that out of the two hundredrespondents 105 (52.5%) were general practitioners,95 (47.5%) were family medicine practitioners, 89(44.5 %) were male while 111 (55.5 %) were female.The majority of them (96, 48 %) were aged < 35years. As regards their years of experience inKuwait primary health center, 30.5% had less thanfive years and 29% had more than fifteen years(Table 1).Doctors were asked about their perception ofperformance satisfaction level on pre v e n t i o nm e a s u res. This questioning was related to BPm e a s u rements, evaluations of blood sugar andcholesterol levels, counseling on smoking cessation,diet and breast self-examination. Almost all of themhave replied it should be > 75% as shown in Table2. However, in actual practice delivery ofpreventive measures was less than 75% (Table 3).Consequently, 72% of practitioners estimatedthat the level of satisfaction for deliveringpreventive measures for BP checking to be > 75%during actual practice. On the contrary, only 29.5%out of the 72% rated it as being > 75%. Now, withrespect to diet counseling 49.5% of them expected itto be > 75%. However, only 9.0% out of the 49.5%rated it as being > 75% in actual practice.L a t e r, doctors were asked about certainobstacles that cause failure in providing preventionmeasures. They pointed out that insufficient timewas the most important obstacle. Percentages forthis obstacle vary from one test to another. Forexample, 48.5% was for BP measurements, 38.5%