Structural Design and Response in Collision and Grounding
Structural Design and Response in Collision and Grounding
Structural Design and Response in Collision and Grounding

Create successful ePaper yourself
Turn your PDF publications into a flip-book with our unique Google optimized e-Paper software.
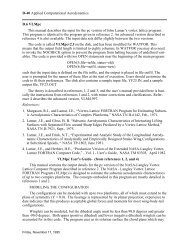
4.2.2 Method by Wang [15]Dr. Wang developed a method to predict structuralresistance <strong>in</strong> rak<strong>in</strong>g type ground<strong>in</strong>g <strong>in</strong> his doctoral workunder Professor Hideomi Ohtsubo’s supervision. Themethod was further developed <strong>and</strong> published <strong>in</strong> 1997[15].Figure 6 - Four Failure Modes <strong>in</strong> the Method by WangThe method <strong>in</strong>cludes closed-form solutions for fourfailure modes: stretch<strong>in</strong>g (beam mode), dent<strong>in</strong>g, tear<strong>in</strong>g<strong>and</strong> concert<strong>in</strong>a tear<strong>in</strong>g illustrated <strong>in</strong> Figure 6.The rock is modeled as a wedge, <strong>and</strong> the ship’sbottom structure is modeled with periodic structuralmembers where the period corresponds to transverseframe spac<strong>in</strong>g. Only horizontal ship motions areconsidered <strong>in</strong> the calculation.The ground<strong>in</strong>g damage is calculated by comb<strong>in</strong><strong>in</strong>gthe failure modes to model periodic resistance of thestructure. The resistance of the transverse structure ispredicted with a beam model. The dent<strong>in</strong>g failure mode isassumed for the plate immediately beh<strong>in</strong>d the transversestructure. As the wedge advances <strong>in</strong> the plat<strong>in</strong>g <strong>and</strong> acrack develops at the tip of the wedge, the rupture ismodeled by tear<strong>in</strong>g failure mode. Concert<strong>in</strong>a tear<strong>in</strong>g isused to model the accordion like behavior of the plat<strong>in</strong>g,which can lead to cracks at other locations than the tip ofthe wedge. The entire calculation can be carried out byh<strong>and</strong> or with a simple spreadsheet program, but theanalyst must decide how the failure modes are comb<strong>in</strong>edto achieve the f<strong>in</strong>al damage.4.3 ApplicationDAMAGE was selected for further test<strong>in</strong>g <strong>and</strong> analysis,because of its applicability to a wider range of ground<strong>in</strong>gscenarios. Although the method by Wang is elegant <strong>in</strong> itssimplicity, its application <strong>in</strong> the current formulation islimited to rak<strong>in</strong>g type damage only. The majorlimitations of the current version of DAMAGE are thetype of obstruction (p<strong>in</strong>nacle only), <strong>and</strong> the structuralmodel (the structure is modeled for the cargo block only).4.3.1 Validation of DAMAGESimonsen presented verification of the theory beh<strong>in</strong>dDAMAGE models by compar<strong>in</strong>g calculated results withUS NAVY 1/5-scale ground<strong>in</strong>g experiments, with largescaleground<strong>in</strong>g experiments carried out <strong>in</strong> theNetherl<strong>and</strong>s, <strong>and</strong> with an actual ground<strong>in</strong>g of a VLCC[14,16].Based on the limited number of validation casesDAMAGE is found to predict the damage extent well. Inthe case of a VLCC ground<strong>in</strong>g, the difference between thecalculated damage length of 177 meters <strong>and</strong> the observeddamage length of approximately 180 meters is only 1.7%.The result is sensitive to the transverse location of therock relative to the ship’s centerl<strong>in</strong>e as is illustrated <strong>in</strong>Figure 7. As the rock moves away from the centerl<strong>in</strong>e theeffect of ship motions <strong>in</strong>crease <strong>and</strong> the predicted damagelength <strong>in</strong>creases.DAMAGE predictions for average rock penetration<strong>and</strong> ground<strong>in</strong>g force are also excellent. Predictions form<strong>in</strong>imum <strong>and</strong> maximum values are not as good. Figures8-10 illustrate a comparison of DAMAGE results with alarge-scale ground<strong>in</strong>g test carried out <strong>in</strong> the Netherl<strong>and</strong>sby ASIS. Large differences <strong>in</strong> the penetration at the<strong>in</strong>itial stages of ground<strong>in</strong>g are probably due tosimplifications <strong>in</strong> the global motion calculations.Rock Penetration (m)5432-50 0 50 100 150Longitud<strong>in</strong>al Position (m)e=0e=5e=10Figure 7 - Rock Penetration vs. Rock EccentricityVertical Penetration (m)1.41.210.80.60.40.20DAMAGE0 0.5 1 1.5 2 2.5 3Time (sec)MeasuredFigure 8 - Vertical Penetration (ASIS Test 2)5