- Page 5:
Table of ContentsPageABBREVIATIONS
- Page 8 and 9:
Chapter 9. Infrastructure, Public U
- Page 10 and 11:
Investment in QualityTable 2.9: Ave
- Page 12 and 13:
Investment in QualityTable 7.12: Pe
- Page 14 and 15:
Investment in QualityLIST OF FIGURE
- Page 16 and 17:
Investment in QualityLIST OF BOXESB
- Page 18 and 19:
CWCDARTDSLDTODWSECECHPECJEEAEGFSNEM
- Page 20 and 21:
NESCNESDONESFNGONICsNMWNPMNSSNTRNWC
- Page 22 and 23:
xviii
- Page 24 and 25:
Investment in Qualitynew economic a
- Page 26 and 27:
xxii
- Page 29 and 30:
CHAPTER 1IRELAND’S LONG RUN ECONO
- Page 31 and 32:
Ireland’s Long Run Economic Devel
- Page 33 and 34:
Ireland’s Long Run Economic Devel
- Page 35 and 36:
Ireland’s Long Run Economic Devel
- Page 37 and 38:
Ireland’s Long Run Economic Devel
- Page 39 and 40:
Ireland’s Long Run Economic Devel
- Page 41 and 42:
Ireland’s Long Run Economic Devel
- Page 43 and 44:
Ireland’s Long Run Economic Devel
- Page 45 and 46:
Ireland’s Long Run Economic Devel
- Page 47 and 48:
Ireland’s Long Run Economic Devel
- Page 49 and 50:
Ireland’s Long Run Economic Devel
- Page 51 and 52:
Ireland’s Long Run Economic Devel
- Page 53 and 54:
Ireland’s Long Run Economic Devel
- Page 55 and 56:
Ireland’s Long Run Economic Devel
- Page 57 and 58:
Ireland’s Long Run Economic Devel
- Page 59 and 60:
Ireland’s Long Run Economic Devel
- Page 61 and 62:
Ireland’s Long Run Economic Devel
- Page 63 and 64:
Ireland’s Long Run Economic Devel
- Page 65 and 66:
Ireland’s Long Run Economic Devel
- Page 67 and 68:
Ireland’s Long Run Economic Devel
- Page 69 and 70:
Ireland’s Long Run Economic Devel
- Page 71 and 72:
Ireland’s Long Run Economic Devel
- Page 73 and 74:
growth. Second, there was a dramati
- Page 75 and 76:
Ireland’s Long Run Economic Devel
- Page 77 and 78:
Ireland’s Long Run Economic Devel
- Page 79 and 80:
own interpretation it becomes clear
- Page 81 and 82:
CHAPTER 2IRELAND’S LONG RUN SOCIA
- Page 83 and 84:
Ireland’s Long Run Social Develop
- Page 85 and 86:
Ireland’s Long Run Social Develop
- Page 87 and 88:
Ireland’s Long Run Social Develop
- Page 89 and 90:
Ireland’s Long Run Social Develop
- Page 91 and 92:
Ireland’s Long Run Social Develop
- Page 93 and 94:
Ireland’s Long Run Social Develop
- Page 95 and 96:
Ireland’s Long Run Social Develop
- Page 97 and 98:
Ireland’s Long Run Social Develop
- Page 99 and 100:
Ireland’s Long Run Social Develop
- Page 101 and 102:
Ireland’s Long Run Social Develop
- Page 103 and 104:
Ireland’s Long Run Social Develop
- Page 105 and 106:
Ireland’s Long Run Social Develop
- Page 107 and 108:
Ireland’s Long Run Social Develop
- Page 109 and 110:
Ireland’s Long Run Social Develop
- Page 111 and 112:
Ireland’s Long Run Social Develop
- Page 113 and 114:
Ireland’s Long Run Social Develop
- Page 115 and 116:
Ireland’s Long Run Social Develop
- Page 117 and 118:
Ireland’s Long Run Social Develop
- Page 119 and 120:
3. Those that are currently landfil
- Page 121 and 122:
not starting from scratch. Ireland
- Page 123 and 124:
Ireland’s Long Run Social Develop
- Page 125 and 126:
Ireland’s Long Run Social Develop
- Page 127 and 128:
Ireland’s Long Run Social Develop
- Page 129 and 130:
Ireland’s Long Run Social Develop
- Page 131 and 132:
Ireland’s Long Run Social Develop
- Page 133 and 134:
Ireland’s Long Run Social Develop
- Page 135 and 136:
Ireland’s Long Run Social Develop
- Page 137 and 138:
Ireland’s Long Run Social Develop
- Page 139 and 140:
Ireland’s Long Run Social Develop
- Page 141 and 142:
Ireland’s Long Run Social Develop
- Page 143 and 144:
Ireland’s Long Run Social Develop
- Page 145 and 146:
Ireland’s Long Run Social Develop
- Page 147 and 148:
Ireland’s Long Run Social Develop
- Page 149 and 150:
Ireland’s Long Run Social Develop
- Page 151 and 152:
eal disposable incomes rose by some
- Page 153 and 154:
Ireland’s Long Run Social Develop
- Page 155 and 156:
Ireland’s Long Run Social Develop
- Page 157 and 158:
Ireland’s Long Run Social Develop
- Page 159 and 160:
Ireland’s Long Run Social Develop
- Page 161 and 162:
Ireland’s Long Run Social Develop
- Page 163 and 164:
Part IIVision137
- Page 165 and 166:
CHAPTER 3EXPERIENCE, UNDERSTANDING
- Page 167 and 168:
●Experience, Understanding and Ne
- Page 169 and 170:
Experience, Understanding and New P
- Page 171 and 172:
Experience, Understanding and New P
- Page 173 and 174:
more diverse, fragmented and decent
- Page 175 and 176:
Experience, Understanding and New P
- Page 177 and 178:
Experience, Understanding and New P
- Page 179 and 180:
●Experience, Understanding and Ne
- Page 181 and 182:
Experience, Understanding and New P
- Page 183 and 184:
Experience, Understanding and New P
- Page 185 and 186:
Experience, Understanding and New P
- Page 187 and 188:
3.7.3 From a Differentiated to a De
- Page 189 and 190:
State might look like (see Figure 3
- Page 191 and 192:
Experience, Understanding and New P
- Page 193 and 194:
without rigid models and revising b
- Page 195 and 196:
Part IIIStrategy169
- Page 197 and 198:
CHAPTER 4RECASTING IRELAND’S CONS
- Page 199 and 200:
Recasting Ireland’s Consistent Po
- Page 201 and 202:
●●●Recasting Ireland’s Cons
- Page 203 and 204:
Recasting Ireland’s Consistent Po
- Page 205 and 206:
Recasting Ireland’s Consistent Po
- Page 207 and 208:
CHAPTER 5MACROECONOMIC POLICY5.1 IN
- Page 209 and 210:
Macroeconomic Policymoved into a su
- Page 211 and 212:
Macroeconomic PolicyFIGURE 5.4Total
- Page 213 and 214:
Macroeconomic PolicyTABLE 5.1Curren
- Page 215 and 216:
Macroeconomic Policy1987. It fell t
- Page 217 and 218:
Macroeconomic PolicyTABLE 5.4Public
- Page 219 and 220:
Macroeconomic Policydecline in the
- Page 221 and 222:
40.5 per cent of GNP, just over thr
- Page 223 and 224:
Macroeconomic Policygreater decline
- Page 225 and 226:
Macroeconomic Policyture levels are
- Page 227 and 228:
Macroeconomic Policywith organisati
- Page 229 and 230:
Macroeconomic Policythat meet the n
- Page 231 and 232:
Macroeconomic PolicyBOX 5.1Special
- Page 233 and 234:
Macroeconomic Policyinflation over
- Page 235 and 236:
Macroeconomic Policythe prices incr
- Page 237 and 238:
Macroeconomic Policydepends on thei
- Page 239 and 240:
Macroeconomic PolicyWage Determinat
- Page 241 and 242:
Macroeconomic PolicyInfrastructural
- Page 243 and 244:
Macroeconomic Policydegree to which
- Page 245 and 246: Macroeconomic Policyconcern’ has
- Page 247 and 248: Macroeconomic Policyrecommends that
- Page 249 and 250: Wage BargainingSection 6.4 identifi
- Page 251 and 252: Wage Bargainingof externalities ass
- Page 253 and 254: Wage Bargaining6.2.3 The Relation b
- Page 255 and 256: Wage Bargaining6.3 DEVELOPMENTS IN
- Page 257 and 258: Wage Bargainingthe private and publ
- Page 259 and 260: Wage Bargainingbargaining; 2=indust
- Page 261 and 262: Wage Bargainingnational agreements
- Page 263 and 264: Wage Bargainingsteps in decentralis
- Page 265 and 266: Wage Bargaining(1988) curve, combin
- Page 267 and 268: Wage Bargainingprices and a large-s
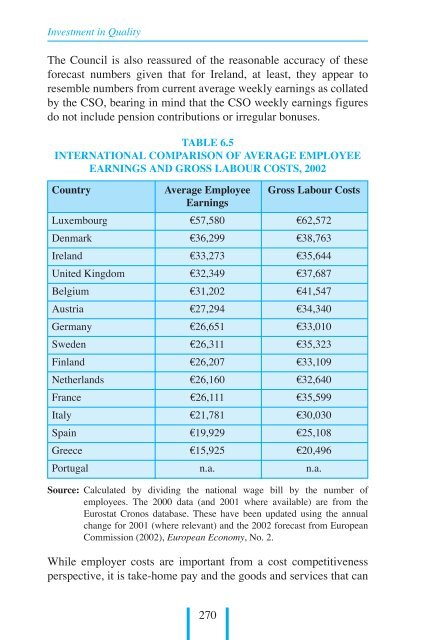
- Page 269 and 270: Wage Bargaining(but some innovative
- Page 271 and 272: Wage Bargainingof the employer fede
- Page 273 and 274: Wage Bargainingrecurrent state inte
- Page 275 and 276: Wage Bargainingpart-time employees
- Page 277 and 278: Wage Bargainingemployment is “a p
- Page 279 and 280: Wage Bargainingreflects differences
- Page 281 and 282: Wage Bargainingamount of the local
- Page 283 and 284: Wage Bargainingmoderation in earnin
- Page 285 and 286: Wage Bargaining6.4.2 The Minimum Wa
- Page 287 and 288: Wage Bargaining3 per cent per annum
- Page 289 and 290: Wage Bargainingof 0.3 per cent per
- Page 291 and 292: Wage Bargaining6.4.4 Relative Wages
- Page 293 and 294: Wage Bargainingweighted by employme
- Page 295: Wage Bargainingtraded goods sectors
- Page 299 and 300: Wage BargainingTABLE 6.7Labour Cost
- Page 301 and 302: Wage BargainingAbove all these sche
- Page 303 and 304: Wage Bargainingcomposition of publi
- Page 305 and 306: Wage BargainingPublic Service Moder
- Page 307 and 308: Wage Bargainingpublic service can c
- Page 309 and 310: Wage Bargaininglearn from. Neverthe
- Page 311 and 312: Wage Bargainingpay awards compatibl
- Page 313 and 314: Wage Bargainingcomparison with wage
- Page 315 and 316: Wage Bargainingbenchmarking pay awa
- Page 317 and 318: Tax and Social Welfare●●●●
- Page 319 and 320: Tax and Social WelfareThe main sour
- Page 321 and 322: Following reductions in recent year
- Page 323 and 324: Tax and Social WelfareThe fall in a
- Page 325 and 326: effect by 1999/2000. Nonetheless, t
- Page 327 and 328: the earnings distribution. About tw
- Page 329 and 330: Tax and Social Welfaretraded servic
- Page 331 and 332: Tax and Social Welfare●●●●
- Page 333 and 334: TABLE 7.7Percentage and Breakdown o
- Page 335 and 336: Tax and Social Welfare7.5.2 Specifi
- Page 337 and 338: Tax and Social WelfareTABLE 7.9Lowe
- Page 339 and 340: Tax and Social Welfareparticularly
- Page 341 and 342: udgets are being framed is that (i)
- Page 343 and 344: currently being experienced by stat
- Page 345 and 346: Tax and Social WelfareWorking Group
- Page 347 and 348:
Tax and Social Welfarefor lower soc
- Page 349 and 350:
Lone parents and large families wer
- Page 351 and 352:
‘Not Working’ categories. Table
- Page 353 and 354:
Tax and Social Welfaremeasured, dro
- Page 355 and 356:
Tax and Social Welfare2. The Benchm
- Page 357 and 358:
Tax and Social Welfareincrease in c
- Page 359 and 360:
Tax and Social Welfareof designing
- Page 361 and 362:
Tax and Social Welfaretargets for r
- Page 363 and 364:
Tax and Social Welfaredifferent fac
- Page 365 and 366:
Tax and Social WelfareThe Adequacy
- Page 367 and 368:
Tax and Social WelfareAPPENDIXTABLE
- Page 369 and 370:
Tax and Social WelfareNOTE: Figures
- Page 371 and 372:
CHAPTER 8POLICIES ON POVERTY, EXCLU
- Page 373 and 374:
Policies on Poverty, Exclusion and
- Page 375 and 376:
Policies on Poverty, Exclusion and
- Page 377 and 378:
Policies on Poverty, Exclusion and
- Page 379 and 380:
Policies on Poverty, Exclusion and
- Page 381 and 382:
Policies on Poverty, Exclusion and
- Page 383 and 384:
●●●●Policies on Poverty, Ex
- Page 385 and 386:
Policies on Poverty, Exclusion and
- Page 387 and 388:
Policies on Poverty, Exclusion and
- Page 389 and 390:
Policies on Poverty, Exclusion and
- Page 391 and 392:
Policies on Poverty, Exclusion and
- Page 393 and 394:
Policies on Poverty, Exclusion and
- Page 395 and 396:
Policies on Poverty, Exclusion and
- Page 397 and 398:
Policies on Poverty, Exclusion and
- Page 399 and 400:
Key determinants of progress toward
- Page 401 and 402:
andPolicies on Poverty, Exclusion a
- Page 403 and 404:
Policies on Poverty, Exclusion and
- Page 405 and 406:
Policies on Poverty, Exclusion and
- Page 407 and 408:
Policies on Poverty, Exclusion and
- Page 409 and 410:
Policies on Poverty, Exclusion and
- Page 411 and 412:
Policies on Poverty, Exclusion and
- Page 413 and 414:
Policies on Poverty, Exclusion and
- Page 415 and 416:
Policies on Poverty, Exclusion and
- Page 417 and 418:
Policies on Poverty, Exclusion and
- Page 419 and 420:
Policies on Poverty, Exclusion and
- Page 421 and 422:
Policies on Poverty, Exclusion and
- Page 423 and 424:
Policies on Poverty, Exclusion and
- Page 425 and 426:
types of employment which women lea
- Page 427 and 428:
Policies on Poverty, Exclusion and
- Page 429 and 430:
Policies on Poverty, Exclusion and
- Page 431 and 432:
Policies on Poverty, Exclusion and
- Page 433 and 434:
Policies on Poverty, Exclusion and
- Page 435 and 436:
Policies on Poverty, Exclusion and
- Page 437 and 438:
Policies on Poverty, Exclusion and
- Page 439 and 440:
Policies on Poverty, Exclusion and
- Page 441 and 442:
Policies on Poverty, Exclusion and
- Page 443 and 444:
Policies on Poverty, Exclusion and
- Page 445 and 446:
Policies on Poverty, Exclusion and
- Page 447 and 448:
●Policies on Poverty, Exclusion a
- Page 449 and 450:
Policies on Poverty, Exclusion and
- Page 451 and 452:
Policies on Poverty, Exclusion and
- Page 453 and 454:
Policies on Poverty, Exclusion and
- Page 455 and 456:
Policies on Poverty, Exclusion and
- Page 457 and 458:
Policies on Poverty, Exclusion and
- Page 459 and 460:
CHAPTER 9INFRASTRUCTURE, PUBLIC UTI
- Page 461 and 462:
Infrastructure, Public Utilities an
- Page 463 and 464:
Infrastructure, Public Utilities an
- Page 465 and 466:
Infrastructure, Public Utilities an
- Page 467 and 468:
As indicated in Chapter 3 the Counc
- Page 469 and 470:
Infrastructure, Public Utilities an
- Page 471 and 472:
Infrastructure, Public Utilities an
- Page 473 and 474:
●Infrastructure, Public Utilities
- Page 475 and 476:
Infrastructure, Public Utilities an
- Page 477 and 478:
Infrastructure, Public Utilities an
- Page 479 and 480:
Infrastructure, Public Utilities an
- Page 481 and 482:
Infrastructure, Public Utilities an
- Page 483 and 484:
Infrastructure, Public Utilities an
- Page 485 and 486:
is possible that the provisions in
- Page 487 and 488:
Infrastructure, Public Utilities an
- Page 489 and 490:
Infrastructure, Public Utilities an
- Page 491 and 492:
Infrastructure, Public Utilities an
- Page 493 and 494:
9.5 ENERGYInfrastructure, Public Ut
- Page 495 and 496:
Infrastructure, Public Utilities an
- Page 497 and 498:
Infrastructure, Public Utilities an
- Page 499 and 500:
Infrastructure, Public Utilities an
- Page 501 and 502:
Infrastructure, Public Utilities an
- Page 503 and 504:
Infrastructure, Public Utilities an
- Page 505 and 506:
Infrastructure, Public Utilities an
- Page 507 and 508:
Infrastructure, Public Utilities an
- Page 509 and 510:
Infrastructure, Public Utilities an
- Page 511 and 512:
Infrastructure, Public Utilities an
- Page 513 and 514:
On reviewing individual regional pl
- Page 515 and 516:
Infrastructure, Public Utilities an
- Page 517 and 518:
Infrastructure, Public Utilities an
- Page 519 and 520:
Infrastructure, Public Utilities an
- Page 521 and 522:
●●Infrastructure, Public Utilit
- Page 523 and 524:
Infrastructure, Public Utilities an
- Page 525 and 526:
Infrastructure, Public Utilities an
- Page 527 and 528:
Infrastructure, Public Utilities an
- Page 529 and 530:
Infrastructure, Public Utilities an
- Page 531 and 532:
Infrastructure, Public Utilities an
- Page 533 and 534:
Infrastructure, Public Utilities an
- Page 535 and 536:
Infrastructure, Public Utilities an
- Page 537 and 538:
Infrastructure, Public Utilities an
- Page 539 and 540:
Infrastructure, Public Utilities an
- Page 541 and 542:
Infrastructure, Public Utilities an
- Page 543 and 544:
Infrastructure, Public Utilities an
- Page 545 and 546:
Infrastructure, Public Utilities an
- Page 547 and 548:
Infrastructure, Public Utilities an
- Page 549 and 550:
Infrastructure, Public Utilities an
- Page 551 and 552:
Infrastructure, Public Utilities an
- Page 553 and 554:
Infrastructure, Public Utilities an
- Page 555 and 556:
●●●Infrastructure, Public Uti
- Page 557 and 558:
CHAPTER 10COMPETITIVENESS, CONTINUO
- Page 559 and 560:
Competitiveness, Continuous Improve
- Page 561 and 562:
Competitiveness, Continuous Improve
- Page 563 and 564:
Competitiveness, Continuous Improve
- Page 565 and 566:
Competitiveness, Continuous Improve
- Page 567 and 568:
development and a wider national sy
- Page 569 and 570:
Competitiveness, Continuous Improve
- Page 571 and 572:
Competitiveness, Continuous Improve
- Page 573 and 574:
Competitiveness, Continuous Improve
- Page 575 and 576:
Competitiveness, Continuous Improve
- Page 577 and 578:
Competitiveness, Continuous Improve
- Page 579 and 580:
Competitiveness, Continuous Improve
- Page 581 and 582:
Competitiveness, Continuous Improve
- Page 583 and 584:
Competitiveness, Continuous Improve
- Page 585 and 586:
Competitiveness, Continuous Improve
- Page 587 and 588:
The Report of the Taskforce on Life
- Page 589 and 590:
Competitiveness, Continuous Improve
- Page 591 and 592:
Competitiveness, Continuous Improve
- Page 593 and 594:
Competitiveness, Continuous Improve
- Page 595 and 596:
●●Competitiveness, Continuous I
- Page 597 and 598:
Competitiveness, Continuous Improve
- Page 599 and 600:
Competitiveness, Continuous Improve
- Page 601 and 602:
Competitiveness, Continuous Improve
- Page 603 and 604:
Competitiveness, Continuous Improve
- Page 605 and 606:
REFERENCESAcemoglu, D. (2002), ‘T
- Page 607 and 608:
ReferencesBlanchard, O. (2002), ‘
- Page 609 and 610:
ReferencesCentral Statistics Office
- Page 611 and 612:
ReferencesDepartment of Health and
- Page 613 and 614:
ReferencesElvander, N. (1999), The
- Page 615 and 616:
ReferencesExpert Working Group Repo
- Page 617 and 618:
ReferencesGlover, S., C. Gott, A. L
- Page 619 and 620:
ReferencesHoffman, L.W. and L.M. Yo
- Page 621 and 622:
ReferencesLaffan, B., R. O’Donnel
- Page 623 and 624:
ReferencesMorgan M., R. Flanagan an
- Page 625 and 626:
ReferencesNESF (1997a), Early Schoo
- Page 627 and 628:
ReferencesO’Neill, D. and O. Swee
- Page 629 and 630:
ReferencesPoutsma, E. (2001), Recen
- Page 631 and 632:
ReferencesStreeck, W. (1998), ‘Th
- Page 633 and 634:
ReferencesWestern, B. (1997), Betwe
- Page 635 and 636:
NATIONAL ECONOMIC AND SOCIAL COUNCI
- Page 637 and 638:
Publications82. Manpower Policy in