Business Valuation of Polo Ralph Lauren Corporation - Mark Moore ...
Business Valuation of Polo Ralph Lauren Corporation - Mark Moore ...
Business Valuation of Polo Ralph Lauren Corporation - Mark Moore ...
- No tags were found...

Create successful ePaper yourself
Turn your PDF publications into a flip-book with our unique Google optimized e-Paper software.
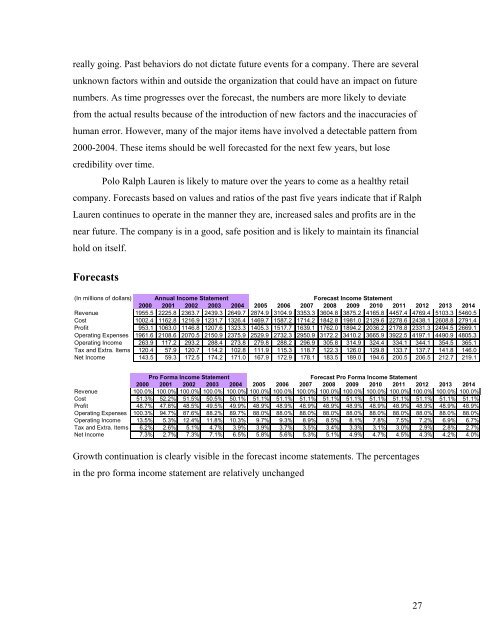
eally going. Past behaviors do not dictate future events for a company. There are severalunknown factors within and outside the organization that could have an impact on futurenumbers. As time progresses over the forecast, the numbers are more likely to deviatefrom the actual results because <strong>of</strong> the introduction <strong>of</strong> new factors and the inaccuracies <strong>of</strong>human error. However, many <strong>of</strong> the major items have involved a detectable pattern from2000-2004. These items should be well forecasted for the next few years, but losecredibility over time.<strong>Polo</strong> <strong>Ralph</strong> <strong>Lauren</strong> is likely to mature over the years to come as a healthy retailcompany. Forecasts based on values and ratios <strong>of</strong> the past five years indicate that if <strong>Ralph</strong><strong>Lauren</strong> continues to operate in the manner they are, increased sales and pr<strong>of</strong>its are in thenear future. The company is in a good, safe position and is likely to maintain its financialhold on itself.Forecasts(In millions <strong>of</strong> dollars) Annual Income StatementForecast Income Statement2000 2001 2002 2003 2004 2005 2006 2007 2008 2009 2010 2011 2012 2013 2014Revenue 1955.5 2225.8 2363.7 2439.3 2649.7 2874.9 3104.9 3353.3 3604.8 3875.2 4165.8 4457.4 4769.4 5103.3 5460.5Cost 1002.4 1162.8 1216.9 1231.7 1326.4 1469.7 1587.2 1714.2 1842.8 1981.0 2129.6 2278.6 2438.1 2608.8 2791.4Pr<strong>of</strong>it 953.1 1063.0 1146.8 1207.6 1323.3 1405.3 1517.7 1639.1 1762.0 1894.2 2036.2 2178.8 2331.3 2494.5 2669.1Operating Expenses 1961.6 2108.6 2070.5 2150.9 2375.9 2529.9 2732.3 2950.9 3172.2 3410.2 3665.9 3922.5 4197.1 4490.9 4805.3Operating Income 263.9 117.2 293.2 288.4 273.8 279.8 288.2 296.9 305.8 314.9 324.4 334.1 344.1 354.5 365.1Tax and Extra. Items 120.4 57.9 120.7 114.2 102.8 111.9 115.3 118.7 122.3 126.0 129.8 133.7 137.7 141.8 146.0Net Income 143.5 59.3 172.5 174.2 171.0 167.9 172.9 178.1 183.5 189.0 194.6 200.5 206.5 212.7 219.1Pro Forma Income StatementForecast Pro Forma Income Statement2000 2001 2002 2003 2004 2005 2006 2007 2008 2009 2010 2011 2012 2013 2014Revenue 100.0% 100.0% 100.0% 100.0% 100.0% 100.0% 100.0% 100.0% 100.0% 100.0% 100.0% 100.0% 100.0% 100.0% 100.0%Cost 51.3% 52.2% 51.5% 50.5% 50.1% 51.1% 51.1% 51.1% 51.1% 51.1% 51.1% 51.1% 51.1% 51.1% 51.1%Pr<strong>of</strong>it 48.7% 47.8% 48.5% 49.5% 49.9% 48.9% 48.9% 48.9% 48.9% 48.9% 48.9% 48.9% 48.9% 48.9% 48.9%Operating Expenses 100.3% 94.7% 87.6% 88.2% 89.7% 88.0% 88.0% 88.0% 88.0% 88.0% 88.0% 88.0% 88.0% 88.0% 88.0%Operating Income 13.5% 5.3% 12.4% 11.8% 10.3% 9.7% 9.3% 8.9% 8.5% 8.1% 7.8% 7.5% 7.2% 6.9% 6.7%Tax and Extra. Items 6.2% 2.6% 5.1% 4.7% 3.9% 3.9% 3.7% 3.5% 3.4% 3.3% 3.1% 3.0% 2.9% 2.8% 2.7%Net Income 7.3% 2.7% 7.3% 7.1% 6.5% 5.8% 5.6% 5.3% 5.1% 4.9% 4.7% 4.5% 4.3% 4.2% 4.0%Growth continuation is clearly visible in the forecast income statements. The percentagesin the pro forma income statement are relatively unchanged27