Business Valuation of Polo Ralph Lauren Corporation - Mark Moore ...
Business Valuation of Polo Ralph Lauren Corporation - Mark Moore ...
Business Valuation of Polo Ralph Lauren Corporation - Mark Moore ...
- No tags were found...

You also want an ePaper? Increase the reach of your titles
YUMPU automatically turns print PDFs into web optimized ePapers that Google loves.
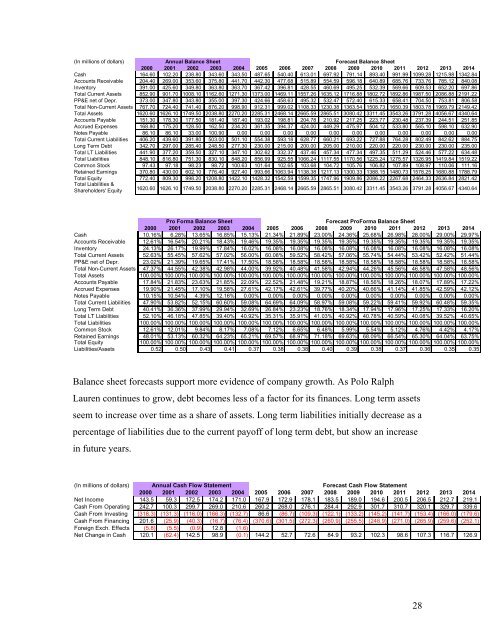
(In millions <strong>of</strong> dollars)Annual Balance SheetForecast Balance Sheet2000 2001 2002 2003 2004 2005 2006 2007 2008 2009 2010 2011 2012 2013 2014Cash 164.60 102.20 238.80 343.60 343.50 487.65 540.40 613.01 697.92 791.14 893.40 991.99 1099.28 1215.98 1342.84Accounts Receivable 204.40 269.00 353.60 375.80 441.70 442.30 477.68 515.89 554.59 596.18 640.89 685.76 733.76 785.12 840.08Inventory 391.00 425.60 349.80 363.80 363.70 367.42 396.81 428.55 460.69 495.25 532.39 569.66 609.53 652.20 697.86Total Current Assets 852.90 901.70 1008.10 1162.60 1271.30 1373.00 1469.11 1557.26 1635.12 1716.88 1802.72 1892.86 1987.50 2086.88 2191.22PP&E net <strong>of</strong> Depr. 373.00 347.80 343.80 355.00 397.30 424.66 458.63 495.32 532.47 572.40 615.33 658.41 704.50 753.81 806.58Total Non-Current Assets 767.70 724.40 741.40 876.20 998.90 912.31 999.02 1108.33 1230.38 1363.54 1508.73 1650.39 1803.78 1969.79 2149.42Total Assets 1620.60 1626.10 1749.50 2038.80 2270.20 2285.31 2468.14 2665.59 2865.51 3080.42 3311.45 3543.26 3791.28 4056.67 4340.64Accounts Payable 151.30 178.30 177.50 181.40 187.40 193.02 198.81 204.78 210.92 217.25 223.77 230.48 237.39 244.51 251.85Accrued Expenses 168.80 175.20 128.50 162.50 234.20 361.35 394.37 424.00 449.29 475.97 504.12 533.80 565.10 598.10 632.90Notes Payable 86.10 86.10 33.00 100.90 0.00 0.00 0.00 0.00 0.00 0.00 0.00 0.00 0.00 0.00 0.00Total Current Liabilities 406.20 439.60 391.80 503.00 501.10 554.38 593.18 628.77 660.21 693.22 727.88 764.28 802.49 842.62 884.75Long Term Debt 342.70 297.00 285.40 248.50 277.30 230.00 215.00 200.00 205.00 210.00 220.00 220.00 230.00 230.00 235.00Total LT Liabilities 441.90 377.20 359.50 327.10 347.10 302.62 332.37 437.46 457.34 477.34 497.35 511.29 524.46 577.22 634.48Total Liabilities 848.10 816.80 751.30 830.10 848.20 856.99 925.55 1066.24 1117.55 1170.56 1225.24 1275.57 1326.95 1419.84 1519.22Common Stock 97.43 97.18 98.23 98.72 100.63 101.64 102.65 103.68 104.72 105.76 106.82 107.89 108.97 110.06 111.16Retained Earnings 370.80 430.00 602.10 776.40 927.40 993.66 1063.94 1138.38 1217.13 1300.33 1388.15 1480.73 1578.25 1680.88 1788.79Total Equity 772.40 809.30 998.20 1208.80 1422.10 1428.32 1542.59 1599.35 1747.96 1909.86 2086.22 2267.68 2464.33 2636.84 2821.42Total Liabilities &Shareholders' Equity1620.60 1626.10 1749.50 2038.80 2270.20 2285.31 2468.14 2665.59 2865.51 3080.42 3311.45 3543.26 3791.28 4056.67 4340.64Pro Forma Balance SheetForecast ProForma Balance Sheet2000 2001 2002 2003 2004 2005 2006 2008 2009 2010 2011 2012 2013 2014Cash 10.16% 6.28% 13.65% 16.85% 15.13% 21.34% 21.89% 23.00% 24.36% 25.68% 26.98% 28.00% 29.00% 29.97%Accounts Receivable 12.61% 16.54% 20.21% 18.43% 19.46% 19.35% 19.35% 19.35% 19.35% 19.35% 19.35% 19.35% 19.35% 19.35%Inventory 24.13% 26.17% 19.99% 17.84% 16.02% 16.08% 16.08% 16.08% 16.08% 16.08% 16.08% 16.08% 16.08% 16.08%Total Current Assets 52.63% 55.45% 57.62% 57.02% 56.00% 60.08% 59.52% 58.42% 57.06% 55.74% 54.44% 53.42% 52.42% 51.44%PP&E net <strong>of</strong> Depr. 23.02% 21.39% 19.65% 17.41% 17.50% 18.58% 18.58% 18.58% 18.58% 18.58% 18.58% 18.58% 18.58% 18.58%Total Non-Current Assets 47.37% 44.55% 42.38% 42.98% 44.00% 39.92% 40.48% 41.58% 42.94% 44.26% 45.56% 46.58% 47.58% 48.56%Total Assets 100.00% 100.00% 100.00% 100.00% 100.00% 100.00% 100.00% 100.00% 100.00% 100.00% 100.00% 100.00% 100.00% 100.00%Accounts Payable 17.84% 21.83% 23.63% 21.85% 22.09% 22.52% 21.48% 19.21% 18.87% 18.56% 18.26% 18.07% 17.89% 17.22%Accrued Expenses 19.90% 21.45% 17.10% 19.58% 27.61% 42.17% 42.61% 39.77% 40.20% 40.66% 41.14% 41.85% 42.59% 42.12%Notes Payable 10.15% 10.54% 4.39% 12.16% 0.00% 0.00% 0.00% 0.00% 0.00% 0.00% 0.00% 0.00% 0.00% 0.00%Total Current Liabilities 47.90% 53.82% 52.15% 60.60% 59.08% 64.69% 64.09% 58.97% 59.08% 59.22% 59.41% 59.92% 60.48% 59.35%Long Term Debt 40.41% 36.36% 37.99% 29.94% 32.69% 26.84% 23.23% 18.76% 18.34% 17.94% 17.96% 17.25% 17.33% 16.20%Total LT Liabilities 52.10% 46.18% 47.85% 39.40% 40.92% 35.31% 35.91% 41.03% 40.92% 40.78% 40.59% 40.08% 39.52% 40.65%Total Liabilities 100.00% 100.00% 100.00% 100.00% 100.00% 100.00% 100.00% 100.00% 100.00% 100.00% 100.00% 100.00% 100.00% 100.00%Common Stock 12.61% 12.01% 9.84% 8.17% 7.08% 7.12% 6.65% 6.48% 5.99% 5.54% 5.12% 4.76% 4.42% 4.17%Retained Earnings 48.01% 53.13% 60.32% 64.23% 65.21% 69.57% 68.97% 71.18% 69.63% 68.09% 66.54% 65.30% 64.04% 63.75%Total Equity 100.00% 100.00% 100.00% 100.00% 100.00% 100.00% 100.00% 100.00% 100.00% 100.00% 100.00% 100.00% 100.00% 100.00%Liabilities/Assets 0.52 0.50 0.43 0.41 0.37 0.38 0.38 0.40 0.39 0.38 0.37 0.36 0.35 0.35Balance sheet forecasts support more evidence <strong>of</strong> company growth. As <strong>Polo</strong> <strong>Ralph</strong><strong>Lauren</strong> continues to grow, debt becomes less <strong>of</strong> a factor for its finances. Long term assetsseem to increase over time as a share <strong>of</strong> assets. Long term liabilities initially decrease as apercentage <strong>of</strong> liabilities due to the current pay<strong>of</strong>f <strong>of</strong> long term debt, but show an increasein future years.(In millions <strong>of</strong> dollars) Annual Cash Flow StatementForecast Cash Flow Statement2000 2001 2002 2003 2004 2005 2006 2007 2008 2009 2010 2011 2012 2013 2014Net Income 143.5 59.3 172.5 174.2 171.0 167.9 172.9 178.1 183.5 189.0 194.6 200.5 206.5 212.7 219.1Cash From Operating 242.7 100.3 299.7 269.0 210.6 260.2 268.0 276.1 284.4 292.9 301.7 310.7 320.1 329.7 339.6Cash From Investing (318.3) (131.3) (116.0) (166.3) (132.7) 86.6 (86.7) (109.3) (122.1) (133.2) (145.2) (141.7) (153.4) (166.0) (179.6)Cash From Financing 201.6 (25.9) (40.3) (16.7) (76.4) (370.6) (301.5) (272.3) (260.9) (255.5) (248.9) (271.0) (265.9) (259.6) (252.1)Foreign Exch. Effects (5.8) (5.5) (0.9) 12.8 (1.6)Net Change in Cash 120.1 (62.4) 142.5 98.9 (0.1) 144.2 52.7 72.6 84.9 93.2 102.3 98.6 107.3 116.7 126.928