Outlook for Air Transport to the Year 2025 - FILT CGIL Foggia
Outlook for Air Transport to the Year 2025 - FILT CGIL Foggia
Outlook for Air Transport to the Year 2025 - FILT CGIL Foggia
- No tags were found...

Create successful ePaper yourself
Turn your PDF publications into a flip-book with our unique Google optimized e-Paper software.
Cir 313AT/134<strong>Outlook</strong> <strong>for</strong><strong>Air</strong> <strong>Transport</strong><strong>to</strong> <strong>the</strong> <strong>Year</strong> <strong>2025</strong>Approved by <strong>the</strong> Secretary Generaland published under his authoritySeptember 2007International Civil Aviation Organization
Published in separate English, Arabic, French, Russian and Spanish editions by <strong>the</strong> International Civil AviationOrganization. All correspondence, except orders and subscriptions, should be addressed <strong>to</strong> <strong>the</strong> Secretary General.Orders should be sent <strong>to</strong> one of <strong>the</strong> following addresses, <strong>to</strong>ge<strong>the</strong>r with <strong>the</strong> appropriate remittance in U.S. dollars or in <strong>the</strong> currency of <strong>the</strong>country in which <strong>the</strong> order is placed. Cus<strong>to</strong>mers are encouraged <strong>to</strong> use credit cards (MasterCard, Visa or American Express) <strong>to</strong> avoiddelivery delays. In<strong>for</strong>mation on payment by credit card and by o<strong>the</strong>r methods is available in <strong>the</strong> Ordering In<strong>for</strong>mation Section of <strong>the</strong>Catalogue of ICAO Publications and Audio-visual Training Aids.International Civil Aviation Organization. Attention: Document Sales Unit, 999 University Street, Montréal, Quebec, Canada H3C 5H7Telephone: +1 514-954-8022; Facsimile: +1 514-954-6769; Sitatex: YULCAYA; E-mail: sales@icao.int;World Wide Web: http://www.icao.intCameroon. KnowHow, 1, Rue de la Chambre de Commerce-Bonanjo, B.P. 4676, Douala / Telephone: +237 343 98 42; Facsimile: +237 343 89 25;E-mail: knowhow_doc@yahoo.frChina. Glory Master International Limited, Room 434B, Hongshen Trade Centre, 428 Dong Fang Road, Pudong, Shanghai 200120Telephone: +86 137 0177 4638; Facsimile: +86 21 5888 1629; E-mail: glorymaster@online.sh.cnEgypt. ICAO Regional Direc<strong>to</strong>r, Middle East Office, Egyptian Civil Aviation Complex, Cairo <strong>Air</strong>port Road, Heliopolis, Cairo 11776Telephone: +20 2 267 4840; Facsimile: +20 2 267 4843; Sitatex: CAICAYA; E-mail: icaomid@cairo.icao.intGermany. UNO-Verlag GmbH, August-Bebel-Allee 6, 53175 Bonn / Telephone: +49 0 228-94 90 2-0; Facsimile: +49 0 228-94 90 2-22;E-mail: info@uno-verlag.de; World Wide Web: http://www.uno-verlag.deIndia. Ox<strong>for</strong>d Book and Stationery Co., 57, Medha Apartments, Mayur Vihar, Phase-1, New Delhi – 110 091Telephone: +91 11 65659897; Facsimile: +91 11 22743532India. Sterling Book House – SBH, 181, Dr. D. N. Road, Fort, Bombay 400001Telephone: +91 22 2261 2521, 2265 9599; Facsimile: +91 22 2262 3551; E-mail: sbh@vsnl.comIndia. The English Book S<strong>to</strong>re, 17-L Connaught Circus, New Delhi 110001Telephone: +91 11 2341-7936, 2341-7126; Facsimile: +91 11 2341-7731; E-mail: ebs@vsnl.comJapan. Japan Civil Aviation Promotion Foundation, 15-12, 1-chome, Toranomon, Mina<strong>to</strong>-Ku, TokyoTelephone: +81 3 3503-2686; Facsimile: +81 3 3503-2689Kenya. ICAO Regional Direc<strong>to</strong>r, Eastern and Sou<strong>the</strong>rn African Office, United Nations Accommodation, P.O. Box 46294, NairobiTelephone: +254 20 7622 395; Facsimile: +254 20 7623 028; Sitatex: NBOCAYA; E-mail: icao@icao.unon.orgMexico. Direc<strong>to</strong>r Regional de la OACI, Oficina Norteamérica, Centroamérica y Caribe, Av. Presidente Masaryk No. 29, 3 er Piso,Col. Chapultepec Morales, C.P. 11570, México D.F. / Teléfono: +52 55 52 50 32 11; Facsímile: +52 55 52 03 27 57;Correo-e: icao_nacc@mexico.icao.intNigeria. Landover Company, P.O. Box 3165, Ikeja, LagosTelephone: +234 1 4979780; Facsimile: +234 1 4979788; Sitatex: LOSLORK; E-mail: aviation@landovercompany.comPeru. Direc<strong>to</strong>r Regional de la OACI, Oficina Sudamérica, Av. Víc<strong>to</strong>r Andrés Belaúnde No. 147, San Isidro, Lima (Centro Empresarial Real, VíaPrincipal No. 102, Edificio Real 4, Floor 4)Teléfono: +51 1 611 8686; Facsímile: +51 1 611 8689; Correo-e: mail@lima.icao.intRussian Federation. Aviaizdat, 48, Ivan Franko Street, Moscow 121351 / Telephone: +7 095 417-0405; Facsimile: +7 095 417-0254Senegal. Directeur régional de l’OACI, Bureau Afrique occidentale et centrale, Boîte postale 2356, DakarTéléphone: +221 839 9393; Fax: +221 823 6926; Sitatex: DKRCAYA; Courriel: icaodkr@icao.snSlovakia. <strong>Air</strong> Traffic Services of <strong>the</strong> Slovak Republic, Le<strong>to</strong>vé prevádzkové služby Slovenskej Republiky, State Enterprise,Letisko M.R. Štefánika, 823 07 Bratislava 21 / Telephone: +421 2 4857 1111; Facsimile: +421 2 4857 2105; E-mail: sa.icao@lps.skSouth Africa. Avex <strong>Air</strong> Training (Pty) Ltd., Private Bag X102, Halfway House, 1685, JohannesburgTelephone: +27 11 315-0003/4; Facsimile: +27 11 805-3649; E-mail: avex@iafrica.comSpain. A.E.N.A. — Aeropuer<strong>to</strong>s Españoles y Navegación Aérea, Calle Juan Ignacio Luca de Tena, 14, Planta Tercera, Despacho 3. 11,28027 Madrid / Teléfono: +34 91 321-3148; Facsímile: +34 91 321-3157; Correo-e: sscc.ventasoaci@aena.esSwitzerland. Adeco-Editions van Diermen, Attn: Mr. Martin Richard Van Diermen, Chemin du Lacuez 41, CH-1807 BlonayTelephone: +41 021 943 2673; Facsimile: +41 021 943 3605; E-mail: mvandiermen@adeco.orgThailand. ICAO Regional Direc<strong>to</strong>r, Asia and Pacific Office, P.O. Box 11, Samyaek Ladprao, Bangkok 10901Telephone: +66 2 537 8189; Facsimile: +66 2 537 8199; Sitatex: BKKCAYA; E-mail: icao_apac@bangkok.icao.intUnited Kingdom. <strong>Air</strong>plan Flight Equipment Ltd. (AFE), 1a Ringway Trading Estate, Shadowmoss Road, Manchester M22 5LHTelephone: +44 161 499 0023; Facsimile: +44 161 499 0298; E-mail: enquiries@afeonline.com; World Wide Web: http://www.afeonline.comCatalogue of ICAO Publicationsand Audio-visual Training AidsIssued annually, <strong>the</strong> Catalogue lists all publications and audio-visual training aidscurrently available. Supplements <strong>to</strong> <strong>the</strong> Catalogue announce new publications andaudio-visual training aids, amendments, supplements, reprints, etc.Available free from <strong>the</strong> Document Sales Unit, ICAO.5/07
FOREWORDIntroduction1. This circular contains in<strong>for</strong>mation on air transport trends and challenges and long-term airline passengerand freight traffic <strong>for</strong>ecasts, in <strong>to</strong>tal and by region of airline registration, <strong>for</strong> <strong>the</strong> period through <strong>to</strong> <strong>the</strong> year <strong>2025</strong>.In addition, it includes traffic <strong>for</strong>ecasts <strong>for</strong> international route groups and global <strong>for</strong>ecasts of aircraft movements,again through <strong>to</strong> <strong>the</strong> year <strong>2025</strong>. The present circular is <strong>the</strong> sixth in a series issued biennially or triennially (<strong>the</strong>previous edition “<strong>Outlook</strong> <strong>for</strong> <strong>Air</strong> <strong>Transport</strong> <strong>to</strong> <strong>the</strong> <strong>Year</strong> 2015” was published in 2004 as Circular 304).Sources of in<strong>for</strong>mation2. In addition <strong>to</strong> <strong>the</strong> ICAO Digests of Statistics, use has been made of many of <strong>the</strong> Organization’s economicstudies and of <strong>the</strong> Annual Reports of <strong>the</strong> Council <strong>to</strong> <strong>the</strong> Assembly. Sources of in<strong>for</strong>mation o<strong>the</strong>r than ICAO,referred <strong>to</strong> in <strong>the</strong> circular, include <strong>the</strong> appropriate and most recently available statistical publications of <strong>the</strong> UnitedNations, <strong>the</strong> United Nations Conference on Trade and Development (UNCTAD), <strong>the</strong> European Civil AviationConference (ECAC), <strong>the</strong> Organization <strong>for</strong> Economic Co-operation and Development (OECD), <strong>the</strong> International<strong>Air</strong> <strong>Transport</strong> Association (IATA), <strong>the</strong> Association of European <strong>Air</strong>lines (AEA), <strong>the</strong> United States Department of<strong>Transport</strong>ation (DOT) and Department of Energy (DOE), <strong>the</strong> World Tourism Organization (UNWTO), <strong>the</strong>International Monetary Fund (IMF), <strong>the</strong> World Bank, BACK Aviation Solutions and aerospace manufacturers.3. Unless indicated o<strong>the</strong>rwise, all references in this circular <strong>to</strong> “cents” mean U.S. cents, and all references <strong>to</strong>“dollars” mean U.S. dollars; references <strong>to</strong> “billion” mean one thousand million.Status4. This circular has been approved by <strong>the</strong> Secretary General and is published under his authority.___________________(i)
(iv) <strong>Outlook</strong> <strong>for</strong> <strong>Air</strong> <strong>Transport</strong> <strong>to</strong> <strong>the</strong> <strong>Year</strong> <strong>2025</strong>Chapter 6. Forecasts of <strong>Air</strong>craft Movements <strong>to</strong> <strong>the</strong> <strong>Year</strong> <strong>2025</strong> ............................................................ 43Fac<strong>to</strong>rs affecting aircraft movements.................................................................................................... 43Measures of aircraft movements ........................................................................................................... 45Forecasting methodology...................................................................................................................... 45Forecasts of world scheduled aircraft movements ................................................................................ 46PageAPPENDICESAppendix 1. Econometric Models of Demand <strong>for</strong> World Scheduled <strong>Air</strong> Traffic ................................ 48Appendix 2. Model <strong>for</strong> <strong>Air</strong>craft Movement Forecasts........................................................................... 49TABLESTable 1-1. ICAO air traffic <strong>for</strong>ecasts — World (1985–<strong>2025</strong>) ................................................................ 2Table 1-2. ICAO air traffic <strong>for</strong>ecasts — Regions of airline registration (1985–<strong>2025</strong>)........................... 3Table 1-3. ICAO air traffic <strong>for</strong>ecasts — Route groups (19855–<strong>2025</strong>)................................................... 4Table 2-1. Trends in <strong>to</strong>tal scheduled traffic — World (1975–2005)...................................................... 6Table 2-2. International non-scheduled passenger traffic — World (1985 and 2005) ........................... 10Table 2-3. Productivity of international scheduled airlines — World (1965–2005) .............................. 13Table 4-1. Operating revenues and expenses — World (1965–2005).................................................... 25Table 4-2. Total and unit operating revenues and expenses — World (1985 and 2005)........................ 26Table 4-3. Distribution of operating revenues and expenses — World (1985 and 2005) ...................... 31Table 4-4.Distribution of operating revenues and expenses — Regions ofairline registration (1985 and 2005).................................................................................. 32Table 5-1. ICAO scheduled passenger traffic <strong>for</strong>ecasts — World (1985–<strong>2025</strong>).................................... 35Table 5-2. ICAO scheduled passenger traffic — Regions of airline registration (1985–<strong>2025</strong>) ............. 36Table 5-3. ICAO air traffic <strong>for</strong>ecasts— Route groups (1985–<strong>2025</strong>)...................................................... 38Table 5-4. ICAO scheduled freight traffic <strong>for</strong>ecasts — World (1985–<strong>2025</strong>) ........................................ 39Table 5-5. ICAO scheduled freight traffic — Regions of airline registration (1985–<strong>2025</strong>) .................. 40Table 5-6. Global scheduled traffic <strong>for</strong>ecasts by aerospace manufacturers............................................ 42Table 6-1. ICAO aircraft movements <strong>for</strong>ecast — World (1995–<strong>2025</strong>).................................................. 46Table A2-1. Growth in aircraft movements and contributing fac<strong>to</strong>rs — World (1995–<strong>2025</strong>).................. 50FIGURESFigure 2-1. Economic and airline traffic trends — World (1960–2005) ................................................. 6Figure 2-2. Trends in scheduled international and domestic traffic — World (1985 and 2005) ............. 7Figure 2-3. International passenger and freight traffic — Shares by region (1985 and 2005) ................ 8Figure 2-4.Passenger-kilometres per<strong>for</strong>med on scheduled services — Major internationalroute groups (1985 and 2005) ............................................................................................... 9Figure 2-5. Growth in passengers and aircraft movements — World (1960–2005)................................ 11Figure 2-6. Composition of commercial aircraft fleet — World (1960–2005)........................................ 12Figure 2-7. Trends in airline productivity — World (1960–2005) .......................................................... 14Figure 2-8. Input price trends — World (1960–2005)............................................................................. 14Figure 2-9. Trends in airline industry per<strong>for</strong>mance — World (1960–2005) ........................................... 15Figure 2-10. <strong>Air</strong>craft orders, deliveries and operating margin — World (1985–2005)............................. 18Figure 3-1. Growth of real GDP and GDP per capita — World (1985–2005) ........................................ 23
Table of Contents(v)Figure 4-1. Scheduled airline operating revenues and expenses — World (1985–2005)........................ 26Figure 4-2. Financial per<strong>for</strong>mance indica<strong>to</strong>rs of scheduled airlines — World (1985–2005) .................. 27Figure 4-3. Passenger and freight yields of scheduled airlines — World (1975–2005) .......................... 28Figure 4-4.PageChanges in unit operating costs of scheduled airlines and fuel prices— World (1975–2005).......................................................................................................... 29Figure 4-5. Share of fuel and oil in operating expenses of scheduled airlines —World (1985–2005)............................................................................................................... 30Figure 5-1. Trends in scheduled passenger traffic — World (1985–<strong>2025</strong>) ............................................. 35Figure 5-2. Trends in scheduled freight traffic — World (1985–<strong>2025</strong>)................................................... 39Figure 5-3. ICAO <strong>for</strong>ecast accuracy (growth of passenger-kilometres per<strong>for</strong>med)................................. 41Figure 5-4. ICAO <strong>for</strong>ecast accuracy (growth of freight <strong>to</strong>nne-kilometres) ............................................. 42Figure 6-1. Average aircraft size and load fac<strong>to</strong>r — World (1960–2005)............................................... 44Figure 6-2. Average aircraft stage length — World (1960–2005)........................................................... 45___________________
Chapter 1SUMMARY1. During <strong>the</strong> period 1960–2005, <strong>the</strong> aggregate economic activities of <strong>the</strong> world measured by Gross DomesticProduct (GDP) increased at an average annual rate of 3.9 per cent in real terms. For <strong>the</strong> period 1985–2005, GDP andGDP per capita grew at an average annual rate of 3.7 per cent and 2.2 per cent, respectively (see Chapter 3).2. Growth in air transport has been much greater than economic growth but is closely linked with it. Worldairline scheduled passenger traffic (domestic and international) measured in terms of passenger-kilometresper<strong>for</strong>med (PKPs) increased at an average annual rate of 5.7 per cent <strong>for</strong> <strong>the</strong> 1975–2005 period. For <strong>the</strong> periods1975–1985, 1985–1995 and 1995–2005, passenger traffic grew at an average annual rate of 7.0, 5.1 and 5.2 percent, respectively (see Table 2-1).3. World airline scheduled freight traffic (domestic and international) measured in terms of <strong>to</strong>nne-kilometresper<strong>for</strong>med (TKPs) increased at an average annual rate of 6.9 per cent over <strong>the</strong> 1975–2005 period. For <strong>the</strong> periods1975–1985, 1985–1995 and 1995–2005, freight traffic grew at an average annual rate of 7.5, 7.6 and 5.5 per cent,respectively (see Table 2-1).4. The growth in passenger and freight traffic demand over <strong>the</strong> 1975–2005 period resulted in comparablegrowth in capacity offered, while aircraft movements measured in terms of aircraft departures grew at a muchslower rate (3.1 per cent per annum, excluding airlines registered in <strong>the</strong> Commonwealth of Independent States)due primarily <strong>to</strong> increases in average aircraft size and in average distance flown per aircraft departure during thisperiod. His<strong>to</strong>rical traffic trends are described in Chapter 2.5. During <strong>the</strong> period 1975–2005, average world passenger yield measured in real terms (expressed in U.S.cents per PKP) declined at a rate of 2.6 per cent per annum. Freight and mail yield measured in real terms(expressed in U.S. cents per TKP) decreased at a rate of 3.5 per cent per annum. During <strong>the</strong> same period, unitcosts (operating cost per available <strong>to</strong>nne-kilometre (ATK)) measured in real terms declined at an average annualrate of 2.0 per cent (see Chapter 4).6. Future growth of air transport will continue <strong>to</strong> depend primarily on world economic and trade growth andairline cost developments (which are in turn heavily dependent on fuel prices). This growth will also beinfluenced, however, by <strong>the</strong> extent <strong>to</strong> which <strong>the</strong> industry faces up <strong>to</strong> major challenges such as airport and airspacecongestion, environmental protection and increasing capital investment needs. The shape and size of <strong>the</strong> airtransport system will also be affected by governmental decisions, notably those determining <strong>the</strong> type and exten<strong>to</strong>f economic regulation of airlines. <strong>Air</strong>line traffic <strong>for</strong>ecasts are presented in Chapter 5.7. For <strong>the</strong> <strong>for</strong>ecast period 2005–<strong>2025</strong>, world economic growth (GDP) is expected <strong>to</strong> increase at an averageannual rate of 3.5 per cent in real terms. <strong>Air</strong>line yields are expected <strong>to</strong> remain unchanged in real terms <strong>for</strong> <strong>the</strong><strong>for</strong>ecast horizon.8. World scheduled traffic measured in terms of PKPs is <strong>for</strong>ecast <strong>to</strong> increase at a “most likely” averageannual rate of 4.6 per cent <strong>for</strong> <strong>the</strong> period 2005–<strong>2025</strong>. International traffic is expected <strong>to</strong> increase at 5.3 per centper annum, while domestic traffic is expected <strong>to</strong> increase at an average annual rate of 3.4 per cent.9. The airlines of <strong>the</strong> Middle East and <strong>the</strong> Asia/Pacific regions are expected <strong>to</strong> experience <strong>the</strong> highestgrowth in passenger traffic at 5.8 per cent per annum through <strong>to</strong> <strong>the</strong> year <strong>2025</strong>, followed by <strong>the</strong> airlines of <strong>the</strong>1
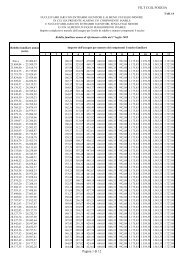
2 <strong>Outlook</strong> <strong>for</strong> <strong>Air</strong> <strong>Transport</strong> <strong>to</strong> <strong>the</strong> <strong>Year</strong> <strong>2025</strong>African and <strong>the</strong> Latin American/Caribbean regions with 5.1 and 4.8 per cent annual growth rates, respectively.Traffic of <strong>the</strong> airlines of <strong>the</strong> European and North American regions is expected <strong>to</strong> grow below <strong>the</strong> world averageat rates of 4.3 and 3.6 per cent per annum, respectively .10. The growth of passenger traffic on <strong>the</strong> major international route groups is expected <strong>to</strong> range from 3 <strong>to</strong> 6per cent per annum through <strong>to</strong> <strong>the</strong> year <strong>2025</strong>.11. World scheduled freight traffic measured in terms of <strong>to</strong>nne-kilometres per<strong>for</strong>med is <strong>for</strong>ecast <strong>to</strong> increase ata “most likely” average annual rate of 6.6 per cent <strong>for</strong> <strong>the</strong> period 2005–<strong>2025</strong>. International freight traffic isexpected <strong>to</strong> increase at an average annual growth rate of 6.9 per cent compared with a domestic freight trafficgrowth of 4.5 per cent per annum. <strong>Air</strong> freight traffic of <strong>the</strong> airlines of <strong>the</strong> Asia/Pacific region is expected <strong>to</strong>remain <strong>the</strong> fastest growing at 8.0 per cent per annum, followed by <strong>the</strong> Middle East region (7.8 per cent). O<strong>the</strong>rregions are projected <strong>to</strong> experience growth rates below <strong>the</strong> world average, ranging from around 4.8 <strong>to</strong> 5.8 per cent.12. <strong>Air</strong>craft movements in terms of aircraft departures and aircraft kilometres flown <strong>for</strong> <strong>the</strong> period 2005–<strong>2025</strong> are expected <strong>to</strong> increase at average annual rates of 3.6 and 4.1 per cent, respectively (see Chapter 6).13. Tables 1-1, 1-2 and 1-3 provide summaries of traffic <strong>for</strong>ecasts at <strong>the</strong> global, regional and route group level.Table 1-1. ICAO air traffic <strong>for</strong>ecasts — World (1985–<strong>2025</strong>)(ICAO Contracting States)Average annual growthrate (per cent)Actual Actual ForecastScheduled services 1985 2005 <strong>2025</strong> 1985–2005 2005–<strong>2025</strong>TOTALPassenger-kilometres (billions) 1 366 3 720 9 180 5.1 4.6Freight <strong>to</strong>nne-kilometres (millions) 39 813 142 579 510 000 6.6 6.6Passengers carried (millions) 896 2 022 4 500 4.2 4.1Freight <strong>to</strong>nnes carried (thousands) 13 742 37 660 145 000 5.2 5.5<strong>Air</strong>craft-kilometres (millions) 1 n.a. 30 845 69 040 n.a. 4.1<strong>Air</strong>craft departures (thousands) 1 n.a. 24 904 50 450 n.a. 3.6INTERNATIONALPassenger-kilometres (billions) 589 2 197 6 225 6.8 5.3Freight <strong>to</strong>nne-kilometres (millions) 29 384 118 482 452 120 7.2 6.9Passengers carried (millions) 194 704 1 950 6.7 5.2Freight <strong>to</strong>nnes carried (thousands) 5 884 22 630 110 000 7.0 6.51. Data on operations of airlines registered in <strong>the</strong> <strong>for</strong>mer USSR not available <strong>for</strong> 1985.Source: ICAO
Chapter 1. Summary 3Table 1-2. ICAO air traffic <strong>for</strong>ecasts — Regions of airline registration (1985–<strong>2025</strong>)(ICAO Contracting States)Average annual growthrate (per cent)Scheduled services by region Actual Actual Forecas<strong>to</strong>f airline registration 1985 2005 <strong>2025</strong> 1985–2005 2005–<strong>2025</strong>TOTALPassenger-kilometres (billions)Africa 36.7 84.8 230 4.3 5.1Asia/Pacific 222.3 967.4 2 980 7.6 5.8Europe 428.2 1 004.9 2 350 4.4 4.3Latin America and Caribbean 68.3 159.2 410 4.3 4.8Middle East 42.7 168.9 520 7.1 5.8North America 567.4 1 334.5 2 690 4.4 3.6Freight <strong>to</strong>nne-kilometres (millions)Africa 1 163 2 349 6 000 3.6 4.8Asia/Pacific 9 605 50 105 235 000 8.6 8.0Europe 14 422 37 875 97 000 4.9 4.8Latin America and Caribbean 2 105 4 567 12 000 3.9 4.9Middle East 1 880 8 880 40 000 8.1 7.8North America 10 638 38 803 120 000 6.7 5.8INTERNATIONALPassenger-kilometres (billions)Africa 28.5 72.2 205 4.8 5.4Asia/Pacific 150.3 622.5 2 100 7.4 6.3Europe 214.4 865.9 2 160 7.2 4.7Latin America and Caribbean 36.5 95.1 260 4.9 5.2Middle East 35.1 152.5 480 7.6 5.9North America 124.5 389.2 1 020 5.9 4.9Freight <strong>to</strong>nne-kilometres (millions)Africa 1 070 2 256 5 870 3.8 4.9Asia/Pacific 8 589 45 070 215 000 8.6 8.1Europe 11 589 36 981 95 900 6.0 4.9Latin America and Caribbean 1 487 3 777 10 600 4.8 5.3Middle East 1 808 8 764 39 750 8.2 7.9North America 4 841 21 634 85 000 7.8 7.1Source: ICAO
4 <strong>Outlook</strong> <strong>for</strong> <strong>Air</strong> <strong>Transport</strong> <strong>to</strong> <strong>the</strong> <strong>Year</strong> <strong>2025</strong>Table 1-3. ICAO air traffic <strong>for</strong>ecasts — Route groups (1985–<strong>2025</strong>)(ICAO Contracting States)Passenger-kilometres per<strong>for</strong>med (billion)Actual1985Actual2005Average annual growthrate (per cent)Forecast<strong>2025</strong> 1985–2005 2005–<strong>2025</strong>International scheduled servicesMid-Atlantic 11.0 58.2 154 8.7 5.0North Atlantic 139.9 434.9 1 049 5.8 4.5South Atlantic 12.5 69.4 210 8.9 5.7Trans-Pacific 67.4 262.5 842 7.0 6.0Between Europe and Africa 37.6 121.8 363 6.0 5.6Between Europe and Asia/Pacific 69.2 263.9 815 6.9 5.8Between Europe and Middle East 25.0 73.2 235 5.5 6.0Between Middle East and Asia/Pacific 23.0 98.4 355 7.5 6.6Between North America and CentralAmerica/Caribbean 21.5 63.1 152 5.5 4.5Between North America and SouthAmerica 13.1 59.8 159 7.9 5.0Intra Africa 4.6 13.4 43 5.5 6.0Intra Asia/Pacific 70.5 295.8 949 7.4 6.0Intra Europe 60.5 253.3 555 7.4 4.0Intra Latin America 8.0 22.6 72 5.3 6.0Intra Middle East 4.5 15.0 44 6.2 5.5Intra North America 15.0 27.4 55 3.0 3.5O<strong>the</strong>r international routes 5.9 65.3 173 12.8 5.0Total international 589.3 2 198.0 6 225 6.8 5.3Domestic scheduled servicesAfrica 8.1 12.6 36 2.2 5.4Asia/Pacific 72.0 344.9 933 8.1 5.1Europe 213.8 139.0 228 –2.1 2.5Latin America 31.8 64.1 169 3.6 5.0Middle East 7.5 16.4 40 4.0 4.6North America 442.9 945.3 1 549 3.9 2.5Total domestic 776.2 1 522.3 2 955 3.4 3.4Global (international + domestic) 1 365.5 3 720.3 9 180 5.1 4.6Note.— The his<strong>to</strong>rical database has been developed from several sources, including ICAO and IATA._____________________
Chapter 2AIR TRANSPORT TRENDS AND CHALLENGESECONOMIC DEVELOPMENT AND AIRLINE TRAFFIC PATTERNS1. From a long-term his<strong>to</strong>rical perspective, air transport has experienced greater growth than most o<strong>the</strong>rindustries. Since 1960, increasing demand <strong>for</strong> passenger and freight services, rapid technological development andassociated investment have combined <strong>to</strong> multiply <strong>the</strong> output of <strong>the</strong> air transport industry by a fac<strong>to</strong>r of more than 30in terms of TKPs. This expansion of air transport compares favourably with <strong>the</strong> broadest available measure of worldoutput, <strong>the</strong> global GDP, which when measured in real terms has multiplied by more than 5 times over <strong>the</strong> sameperiod.2. Economic <strong>the</strong>ory and analytical studies indicate that <strong>the</strong>re is a high correlation between <strong>the</strong> growth patternsof air traffic and economic trends in that <strong>the</strong> demand <strong>for</strong> air transport is primarily driven by economic development.Changes in personal income affect <strong>the</strong> level of consumer purchasing power and <strong>the</strong> propensity <strong>to</strong> undertake leisuretravel. Commercial activity and trade have a direct impact on <strong>the</strong> demand <strong>for</strong> business travel and <strong>for</strong> air freight.Figure 2-1 provides evidence of <strong>the</strong> relationship between <strong>the</strong> strength of <strong>the</strong> economy and traffic demand byillustrating <strong>the</strong> fluctuations in <strong>the</strong> rate of growth of each <strong>for</strong> <strong>the</strong> period 1960 <strong>to</strong> 2005. The impact of economicslowdowns and recessions on air traffic trends is clearly visible during <strong>the</strong> following years or periods: 1974–75,1980–82, 1990–91, 1998 and 2001 (<strong>the</strong> latter coupled with <strong>the</strong> unprecedented events of 11 September).3. Between 1985 and 2005, worldwide scheduled traffic, measured in TKPs, grew at an average annual rateof 5.5 per cent, compared <strong>to</strong> a 3.7 per cent GDP growth. While <strong>the</strong> pattern of traffic growth over that period wasgenerally a reflection of economic conditions, <strong>the</strong> impact of recent event-related developments on air traveldemand (events of 11 September 2001, war in Iraq and <strong>the</strong> SARS outbreak) indicate that <strong>the</strong> air transport industryis sensitive <strong>to</strong> safety and security concerns which influence consumer confidence.4. O<strong>the</strong>r fac<strong>to</strong>rs that have affected traffic demand include airline costs, and hence fares and rates, regula<strong>to</strong>rydevelopments and <strong>the</strong> access <strong>to</strong> air and <strong>to</strong>urism services. Rapid growth in <strong>the</strong> 1960s coincided with <strong>the</strong>replacement of pis<strong>to</strong>n-engine aircraft with jet aircraft which led <strong>to</strong> reduced real fares and increased speed andcom<strong>for</strong>t of travel. In addition <strong>to</strong> an adverse effect on <strong>the</strong> world economy, sharp changes in <strong>the</strong> price of oil andaviation fuel (such as in 1973–1974 and fur<strong>the</strong>r escalation during 1979–1981) have had important effects onairline costs. Most recently airline costs have been negatively affected by increasing insurance and security costsin addition <strong>to</strong> <strong>the</strong> sharp hike in oil prices. More details are provided in paragraph 22.TRENDS IN SCHEDULED PASSENGER, FREIGHT AND MAIL TRAFFIC5. Over <strong>the</strong> decades, <strong>the</strong> growth experienced by <strong>the</strong> <strong>to</strong>tal demand <strong>for</strong> air transport has been shared <strong>to</strong> avarying extent by each of its major components — passenger, freight and mail traffic. The average growth rate <strong>for</strong>each of <strong>the</strong>se components has declined since <strong>the</strong> mid-1970s as shown in Table 2-1. The gradual decline in mailtraffic has been particularly severe, partly because of increasing competition from telecommunications.5
6 <strong>Outlook</strong> <strong>for</strong> <strong>Air</strong> <strong>Transport</strong> <strong>to</strong> <strong>the</strong> <strong>Year</strong> <strong>2025</strong>2015TKPPer cent1050Real GDP–51960 64 70 75 80 85 90 95 2000 2005Source: IMF, ICAO Reporting Form A.Figure 2-1. Economic and airline traffic trends — World (1960–2005)(GDP in real terms and <strong>to</strong>tal scheduled TKPs)Table 2-1. Trends in <strong>to</strong>tal scheduled traffic — World (1975–2005)(ICAO Contracting States)Average annual growth (per cent)Scheduled services 1975–1985 1985–1995 1995–2005Passenger-kilometres 7.0 5.1 5.2Freight <strong>to</strong>nne-kilometres 7.5 7.6 5.5Mail <strong>to</strong>nne-kilometres 4.3 2.5 –1.9Total <strong>to</strong>nne-kilometres 7.1 5.8 5.2Source: ICAO Reporting Form A.6. In 2005, <strong>the</strong> world’s airlines carried over 2.0 billion passengers and 37 million <strong>to</strong>nnes of freight and mail onscheduled services. During <strong>the</strong> same year, airlines per<strong>for</strong>med on scheduled services 3 720 billion passengerkilometres(equivalent <strong>to</strong> 340 billion <strong>to</strong>nne-kilometres), 143 billion freight <strong>to</strong>nne-kilometres (FTKs) and 4.7 billionmail <strong>to</strong>nne-kilometres. Over <strong>the</strong> period 1985–2005 <strong>to</strong>tal scheduled traffic, measured in terms of <strong>to</strong>nne-kilometresper<strong>for</strong>med, grew at an average annual rate of 5.5 per cent.
Chapter 2. <strong>Air</strong> <strong>Transport</strong> Trends and Challenges 7International and domestic traffic7. International traffic has tended <strong>to</strong> grow more rapidly than domestic traffic, particularly in <strong>the</strong> case offreight. Figure 2-2 shows <strong>the</strong> expansion in <strong>the</strong> international and domestic components of scheduled passenger andfreight traffic over <strong>the</strong> period 1985 <strong>to</strong> 2005. Over this 20-year period both passenger and freight traffic almostquadrupled on international routes namely from 589 billion PKPs in 1985 <strong>to</strong> 2 197 billion PKPs in 2005 and from29 384 million FTKs <strong>to</strong> 118 482 million FTKs, respectively.Passenger-kilometres2 5002 1971985 20052 000Billions1 5001 0005005897771 5230InternationalDomesticFreight <strong>to</strong>nne-kilometres130 000118 4821985 2005104 000Millions78 00052 00026 00029 38424 09210 4290InternationalDomesticSource: ICAO Reporting Form A.Figure 2-2. Trends in scheduled international anddomestic traffic — World (1985 and 2005)
8 <strong>Outlook</strong> <strong>for</strong> <strong>Air</strong> <strong>Transport</strong> <strong>to</strong> <strong>the</strong> <strong>Year</strong> <strong>2025</strong>Regional distribution of scheduled international traffic8. Figure 2-3 compares <strong>the</strong> share of international passenger and freight traffic by region of airline registrationin 1985 and 2005. The scheduled international traffic regional ranking in terms of passenger-kilometres per<strong>for</strong>medremained almost unchanged. <strong>Air</strong>lines registered in Europe maintained <strong>the</strong>ir dominance while increasing <strong>the</strong>ir share<strong>to</strong> about 40 per cent. <strong>Air</strong>lines registered in <strong>the</strong> Asia/Pacific region ranked second and saw <strong>the</strong>ir share increase <strong>to</strong>28.3 per cent while <strong>the</strong> share of <strong>the</strong> North American airlines declined <strong>to</strong> about 18 per cent. <strong>Air</strong>lines of <strong>the</strong> MiddleEast region increased <strong>the</strong>ir share <strong>to</strong> 6.9 per cent while <strong>the</strong> shares of Latin American and Caribbean and Africancarriers declined <strong>to</strong> 4.3 per cent and 3.3 per cent, respectively.6.2%1985Passenger-kilometres20054.3%21.1%36.4%17.7%39.4%6.9%6.0%25.5%4.8%28.3%3.3%Freight <strong>to</strong>nne-kilometres198520055.1%3.2%16.5%39.4%18.3%31.2%6.2%7.4%1.9%29.2%3.6%38.0%Europe Africa Asia/Pacific Middle East North America Latin AmericaSource: ICAO Reporting Form A.Note.— Shares may not add up <strong>to</strong> 100 per cent due <strong>to</strong> rounding.Figure 2-3. International passenger and freight traffic —Shares by region (1985 and 2005)
Chapter 2. <strong>Air</strong> <strong>Transport</strong> Trends and Challenges 99. <strong>Air</strong>lines of <strong>the</strong> Asia/Pacific region achieved <strong>the</strong> highest share of air freight traffic of about 38.0 per cent,while <strong>the</strong> European and North American airlines saw <strong>the</strong>ir shares decline <strong>to</strong> 31.2 per cent and 18.3 per cent,respectively, in 2005. <strong>Air</strong>lines of <strong>the</strong> Middle East region increased <strong>the</strong>ir share <strong>to</strong> 7.4 per cent while <strong>the</strong> shares ofLatin American and Caribbean, and African carriers declined <strong>to</strong> 3.2 per cent and 1.9 per cent respectively.Passenger traffic on major international route groups10. Figure 2-4 illustrates trends of scheduled passenger traffic measured in terms of passenger-kilometresper<strong>for</strong>med on major international route groups between 1985 and 2005 (<strong>for</strong> data see Table 1-3). It shows <strong>the</strong>continued dominance of <strong>the</strong> <strong>to</strong>p three major intercontinental route groups (North Atlantic, Europe-Asia/Pacificand Trans-Pacific). O<strong>the</strong>r route groups (such as Europe-Africa, Mid-Atlantic and Europe-Middle East) have beengrowing faster but from a smaller base.TRENDS IN NON-SCHEDULED PASSENGER TRAFFIC11. The global development of non-scheduled traffic has been partially masked by some statistical reportingdeficiencies among non-scheduled air carriers. Available data, however, permit some indications of <strong>the</strong> developmentand importance of charter traffic.450Passenger-kilometres (billions)375300225150751985 20050North AtlanticMid-AtlanticSource: IATA and ICAO.South AtlanticTrans-PacificEurope-Asia/PacificEurope-AfricaEurope-Middle EastMiddle East-Asia/PacificNorth America-South AmericaNorth America-Central America/CaribbeanFigure 2-4. Passenger-kilometres per<strong>for</strong>med on scheduled services —Major international route groups (1985 and 2005)
10 <strong>Outlook</strong> <strong>for</strong> <strong>Air</strong> <strong>Transport</strong> <strong>to</strong> <strong>the</strong> <strong>Year</strong> <strong>2025</strong>12. Non-scheduled air transport is primarily devoted <strong>to</strong> international passenger traffic, with freight traffic anddomestic traffic being relatively small by comparison. The share of non-scheduled passenger traffic in <strong>the</strong> <strong>to</strong>talinternational passenger traffic declined from about 15 per cent during <strong>the</strong> latter part of <strong>the</strong> 1990s <strong>to</strong> around 10 percent in 2005. Table 2-2 provides estimates <strong>for</strong> 1985 and 2005 of non-scheduled passenger traffic carried bynon-scheduled and scheduled carriers. Growth in <strong>the</strong>ir combined non-scheduled international traffic wasapproximately 4.2 per cent per annum on average in terms of PKPs during <strong>the</strong> 1985–2005 period, below <strong>the</strong> 6.8 percent per annum growth rate <strong>for</strong> scheduled international traffic. Non-scheduled traffic is very important onintra-European routes which account <strong>for</strong> <strong>the</strong> largest part of <strong>the</strong> world charter market in terms of passengers, followedby North Atlantic routes.AIRCRAFT MOVEMENTS13. The growing demand <strong>for</strong> passenger and freight air services since 1960 went hand in hand with an expandedfleet capacity. Growth patterns of passenger numbers, aircraft departures and aircraft-kilometres are portrayed inFigure 2-5. A statistical smoothing technique has been used <strong>to</strong> eliminate large, short-term fluctuations in order <strong>to</strong>better illustrate <strong>the</strong> trends in <strong>the</strong> relationships between <strong>the</strong> variables.14. The large gap between <strong>the</strong> growth rates <strong>for</strong> passengers carried and aircraft departures that existed in <strong>the</strong>1960s and 1970s is primarily a reflection of <strong>the</strong> increases in average aircraft size over this period. In <strong>the</strong> 1980s, asthis trend in aircraft size levelled out, <strong>the</strong> growth rate <strong>for</strong> aircraft departures increased <strong>to</strong>wards <strong>the</strong> passengergrowth rate.15. The growth in aircraft-kilometres has been consistently higher than <strong>the</strong> growth in aircraft departures, witha particularly large gap in <strong>the</strong> 1960s and early 1970s, since <strong>the</strong> average aircraft stage length (i.e. average length ofnon-s<strong>to</strong>p flights) has been increasing. The rate of increase in average stage length was greatest when jet aircraftwere replacing pis<strong>to</strong>n-engine aircraft.Table 2-2. International non-scheduled passenger traffic —World (1985 and 2005)(ICAO Contracting States)Passenger-kilometresper<strong>for</strong>med19852005(billions) (billions)Averageannualgrowth(per cent)Non-scheduled carriers 68.7 47.8 –1.8Scheduled carriers 46.1 215.2 –8.0Total 114.8 263.0 –4.2Source: ICAO Reporting Form A.
Chapter 2. <strong>Air</strong> <strong>Transport</strong> Trends and Challenges 111512Passengers carriedPer cent96<strong>Air</strong>craft kilometres3<strong>Air</strong>craft departures01960 65 70 75 80 85 90 95 2000 2005Source: ICAO Reporting Form A.Note.— 5-year moving average of annual growth. Excluding operations of airlines registered in <strong>the</strong>Commonwealth of Independent States (CIS).Figure 2-5. Growth in passengers and aircraft movements — World (1960–2005)(Total scheduled operations)FLEET COMPOSITION AND PRODUCTIVITY16. At <strong>the</strong> end of 2005, <strong>the</strong> scheduled and non-scheduled carriers of ICAO Contracting States had acombined fleet of about 22 130 aircraft of over 9 <strong>to</strong>nnes (t) maximum take-off mass (MTOM) <strong>for</strong> <strong>the</strong>irinternational and domestic operations. This is more than double <strong>the</strong> 1985 fleet. The number of jet aircraft at <strong>the</strong>end of 2005 was some 18 240, which is also more than two and a half times <strong>the</strong> corresponding 1985 fleet. Jetaircraft obviously account <strong>for</strong> an even larger proportion of carriers’ fleet capacity than indicated by <strong>the</strong> relativenumber of aircraft. Figure 2-6 contrasts <strong>the</strong> steep upward trend in <strong>the</strong> number of jet aircraft since 1960 with <strong>the</strong>slow growth in <strong>the</strong> number of turboprop aircraft and <strong>the</strong> decline in pis<strong>to</strong>n-engine aircraft.17. The progressive absorption of advanced aerospace technology in<strong>to</strong> airline fleets has been a major sourceof productivity improvement <strong>for</strong> <strong>the</strong> airline industry, as measured by <strong>the</strong> quantity of output per unit of input. Asingle reliable measure of productivity requires comprehensive measures of output and input. For <strong>the</strong> airlineindustry, TKP, including both passenger and freight traffic, is a measure of aggregate output. However, <strong>the</strong>measurement of productivity is complicated by <strong>the</strong> diversity of inputs, which include aircraft, labour and fuel,among o<strong>the</strong>r resources, and also by <strong>the</strong> complexity of <strong>the</strong> production process. Several partial productivitymeasures <strong>for</strong> <strong>the</strong> aggregated operations of international scheduled airlines are shown in Table 2-3. <strong>Air</strong>craftproductivity refers <strong>to</strong> <strong>the</strong> quantity of TKPs that are obtained from <strong>the</strong> <strong>to</strong>tal payload of <strong>the</strong> scheduled airline fleet.Improvements in <strong>the</strong> average load fac<strong>to</strong>r (<strong>the</strong> percentage of <strong>the</strong> capacity provided by aircraft flights that isoccupied with revenue-earning passengers and freight), aircraft speed, and aircraft utilization (<strong>the</strong> extent <strong>to</strong> which
12 <strong>Outlook</strong> <strong>for</strong> <strong>Air</strong> <strong>Transport</strong> <strong>to</strong> <strong>the</strong> <strong>Year</strong> <strong>2025</strong>aircraft are kept flying on revenue-earning missions) have all contributed <strong>to</strong> growth in aircraft productivity,although increased aircraft utilization has had by far <strong>the</strong> largest impact over <strong>the</strong> past four decades. The threecomponents of aircraft productivity have been combined in<strong>to</strong> a single measure of aircraft productivity whosetrend is included among those illustrated in Figure 2-7. There have been some fluctuations in per<strong>for</strong>mance related<strong>to</strong> business cycle conditions. Over <strong>the</strong> whole 45-year period, aircraft productivity has advanced at an averageannual rate of about 3.2 per cent.18. Estimates <strong>for</strong> labour productivity, in terms of TKP per employee, are also given in Table 2-3, and <strong>the</strong>trend in labour productivity is also illustrated in Figure 2-7. The introduction of labour-saving technology andsystems has resulted in an impressive 6.0 per cent per annum growth (on average) since 1960. The impact ofimprovements in aircraft and engine design is also seen in <strong>the</strong> improvement in fuel productivity which has grownat an average rate of about 2.5 per cent per annum over <strong>the</strong> same period.19. Productivity benefits have come from economies of scale as well as from <strong>the</strong> adoption of new technology.Some of <strong>the</strong> scale economies are closely related <strong>to</strong> <strong>the</strong> new technology. In <strong>the</strong> 1960s, <strong>the</strong> new jets were muchlarger than <strong>the</strong> propeller aircraft <strong>the</strong>y were replacing. The next generation of jet aircraft, which began replacing<strong>the</strong> early jets in <strong>the</strong> 1970s, were larger again. <strong>Air</strong>craft size increased from an average capacity of nine <strong>to</strong>nnes in1960 <strong>to</strong> over 28 <strong>to</strong>nnes in 2005. However, average aircraft capacity has not changed much since 1985.20. An overall index of airline productivity has been derived by combining <strong>the</strong> indices <strong>for</strong> aircraft, labour andfuel productivity in<strong>to</strong> a single average measure (presented in paragraph 23). The average growth in this measurewas about 5.6 per cent per annum between 1960 and 2005.20 000JetsTurboprop15 000Pis<strong>to</strong>nNumber of aircraft10 0005 00001960 65 70 75 80 85 90 95 2000 2005Source: ICAO, BACK Aviation Associates.Note.— As from 2001, turboprop aircraft manufactured in China and <strong>the</strong> Russian Federation are included.Figure 2-6. Composition of commercial aircraft fleet — World (1960–2005)(<strong>Air</strong>craft of 9 <strong>to</strong>nnes MTOM and over)
Chapter 2. <strong>Air</strong> <strong>Transport</strong> Trends and Challenges 13Table 2-3. Productivity of international scheduled airlines — World (1965–2005)(ICAO Contracting States)Average levelsProductivity measure 1965 1975 1985 1995 2005<strong>Air</strong>craft productivity<strong>Air</strong>craft load fac<strong>to</strong>r (per cent) 52 50 58 60 63<strong>Air</strong>craft speed (km/h) 469 600 635 647 674<strong>Air</strong>craft utilization (hours per aircraft per year) 1 678 2 064 2 179 2 790 3 556Labour productivityTKP per employee (thousands) 43 82 144 261 397Fuel productivityTKP per litre of fuel (index) 100 123 187 217 277Note.— Excluding operations of airlines registered in <strong>the</strong> CIS.Source: ICAORELATIONSHIP BETWEEN PRODUCTIVITY, PRICESAND FINANCIAL PERFORMANCE21. Having estimated <strong>the</strong> improvement in productivity per<strong>for</strong>mance achieved by <strong>the</strong> airline industry, <strong>the</strong>questions of how <strong>the</strong> improved productivity was used and who received <strong>the</strong> benefits can be addressed. Byreducing <strong>the</strong> quantities of inputs required <strong>to</strong> produce a unit of output, productivity growth has <strong>the</strong> effect ofreducing <strong>the</strong> cost per unit of output. These cost reductions may be used ei<strong>the</strong>r <strong>to</strong> reduce real fares and rates paidby passengers and shippers or <strong>to</strong> provide airlines with improved financial results.22. Changes in <strong>the</strong> real prices paid <strong>for</strong> inputs (e.g. labour and fuel) purchased by <strong>the</strong> airlines are also reflectedin <strong>the</strong> cost per unit of output, and hence in real fares and rates and in financial per<strong>for</strong>mance. The price trends oftwo of <strong>the</strong> most important inputs, labour and jet fuel, are indicated in Figure 2-8, which also shows <strong>the</strong> trend in<strong>the</strong> Consumer Price Index (CPI). International Monetary Fund (IMF) indices <strong>for</strong> industrial countries are used <strong>for</strong><strong>the</strong> labour price and <strong>the</strong> CPI. The importance of labour cost in <strong>the</strong> <strong>to</strong>tal cost structure of airlines and <strong>the</strong> high rateof increase in wage rates suggested in <strong>the</strong> figure have <strong>to</strong>ge<strong>the</strong>r acted as a powerful incentive <strong>for</strong> <strong>the</strong> improvementin labour productivity observed in Figure 2-7. Fuel is ano<strong>the</strong>r key item on <strong>the</strong> expense side of <strong>the</strong> accounts. Theimpact on expenses of <strong>the</strong> very large fuel price increases in 1973–74 and 1979–80 was partly reversed by <strong>the</strong>price declines in 1985. Fur<strong>the</strong>r hikes in jet fuel prices occurred in 1990, 1996 and 2000 when <strong>the</strong> average annualprice in U.S. dollars reached 85 cents per gallon. Due <strong>to</strong> a contraction in demand, <strong>the</strong> jet fuel price softened <strong>to</strong> 69cents on average in 2002 but has since increased substantially <strong>to</strong> reach an average of 171 cents in 2005 increasing<strong>the</strong> pressure on airline operating costs. As a result, <strong>the</strong> share of fuel and oil costs in <strong>to</strong>tal operating costs ofscheduled airlines climbed <strong>to</strong> 22 per cent in 2005 compared <strong>to</strong> only 10 <strong>to</strong> 15 per cent during <strong>the</strong> 1990s.23. The trends in productivity, input prices, yields (i.e. fares and rates), and financial per<strong>for</strong>mance aresummarized in Figure 2-9. A log scale is used so that <strong>the</strong> slopes of <strong>the</strong> trend lines represent percentage changes.The productivity measure is <strong>the</strong> overall index referred <strong>to</strong> above. An overall input price index has also beendeveloped from individual input prices. Input prices and yields are expressed in real terms (i.e. after removing <strong>the</strong>impact of general inflation). Financial per<strong>for</strong>mance is represented by <strong>the</strong> ratio of revenues <strong>to</strong> expenses, whereexpenses are defined <strong>to</strong> exclude taxes and interest.
14 <strong>Outlook</strong> <strong>for</strong> <strong>Air</strong> <strong>Transport</strong> <strong>to</strong> <strong>the</strong> <strong>Year</strong> <strong>2025</strong>1 4001 050Labour productivityIndex700350<strong>Air</strong>craft productivityFuel productivity01960 65 70 75 80 85 90 95 2000 2005Source: ICAO, BACK Aviation Associates, IMF, OECD.Figure 2-7. Trends in airline productivity — World (1960–2005)1 4001 2001 000Labour pricesIndex800600Jet fuel prices400200CPI01960 65 70 75 80 85 90 95 2000 2005Source: IMF, OECD, US Department of Energy.Figure 2-8. Input price trends — World (1960–2005)
Chapter 2. <strong>Air</strong> <strong>Transport</strong> Trends and Challenges 151 000100ProductivityIndexReal input prices10Revenue/ExpenseReal yield11960 65 70 75 80 85 90 95 2000 2005Source: IMF, ICAO Reporting Forms A and EF.Figure 2-9. Trends in airline industry per<strong>for</strong>mance — World (1960–2005)24. By and large, <strong>the</strong> productivity gains have not been retained by <strong>the</strong> airlines over <strong>the</strong> long term. Most of <strong>the</strong>cost savings associated with <strong>the</strong> full range of labour, fuel and aircraft productivity improvements have beenpassed on <strong>to</strong> <strong>the</strong> consumer in <strong>the</strong> <strong>for</strong>m of lower fares and rates. The impact of productivity improvements hasbeen offset <strong>to</strong> some extent by <strong>the</strong> increases in real input prices in <strong>the</strong> 1970s. A slight increase in <strong>the</strong>se prices canalso be observed in recent years which can be mainly attributed <strong>to</strong> fuel price hikes.25. Although <strong>the</strong>re have been substantial changes in <strong>the</strong> operating results of <strong>the</strong> airline industry in <strong>the</strong> shortand medium terms (see Chapter 4), <strong>the</strong>re has been nei<strong>the</strong>r an improving nor declining trend in financialper<strong>for</strong>mance over <strong>the</strong> long term. A significant sustained upward or downward trend would not be expectedbecause of <strong>the</strong> magnified impact such a trend would have on <strong>the</strong> levels of industry profits or losses.SAFETY AND QUALITY OF SERVICE26. <strong>Air</strong> transport has a strong tradition of giving <strong>to</strong>p priority <strong>to</strong> safety. While <strong>the</strong> traffic growth, productivityimprovement and cost and yield reductions described above have been occurring, a substantial improvement in<strong>the</strong> safety of air travel has been achieved. The number of passenger fatalities per 100 millionpassenger-kilometres flown has fallen from 0.8 in 1960 <strong>to</strong> 0.08 in 1980, 0.03 in 1990 and has ranged between0.05 and 0.01 since <strong>the</strong>n. The year 2005 saw 0.02 passenger fatalities per 100 million passenger-kilometres flown.27. There have also been significant enhancements in <strong>the</strong> quality of service provided <strong>to</strong> airline cus<strong>to</strong>mers.There are many dimensions <strong>to</strong> <strong>the</strong> quality of service, including journey time, convenience and reliability ofservice, com<strong>for</strong>t in <strong>the</strong> aircraft cabin and <strong>the</strong> range of on-board facilities. Some of <strong>the</strong>se fac<strong>to</strong>rs are difficult <strong>to</strong>measure in an objective fashion. However, increases in aircraft speed and average stage length have beenachieved, with positive consequences <strong>for</strong> journey times and passenger convenience. The global average block-
16 <strong>Outlook</strong> <strong>for</strong> <strong>Air</strong> <strong>Transport</strong> <strong>to</strong> <strong>the</strong> <strong>Year</strong> <strong>2025</strong><strong>to</strong>-block aircraft speed increased from 360 kilometres per hour (km/h) in 1960 <strong>to</strong> 630 km/h in 1980 and 674 km/hin 2005 (an increase of about 90 per cent over 1960). There has been little change in block speed since 1980. Theaverage stage length has more than doubled from 470 kilometres in 1960 <strong>to</strong> 1 239 kilometres in 2005. This lattertrend has been associated with more direct flights and fewer s<strong>to</strong>povers <strong>for</strong> refuelling, and hence a greater level ofconvenience <strong>for</strong> <strong>the</strong> passenger. The combined effect of increased aircraft speeds and fewer s<strong>to</strong>povers reducedpassenger <strong>to</strong>tal journey time especially <strong>for</strong> multi-leg trips.28. With <strong>the</strong> growth in air transport demand in response <strong>to</strong> fac<strong>to</strong>rs such as overall economic development,airlines have been able <strong>to</strong> increase service frequency and introduce non-s<strong>to</strong>p flights <strong>for</strong> a greater range ofcity-pairs without increasing costs. This improved service has, in turn, led <strong>to</strong> stimulation of demand in <strong>the</strong> longrun, although <strong>the</strong>re have also been short-term demand contractions due <strong>to</strong> so-called fear and hassle and o<strong>the</strong>r noneconomicfac<strong>to</strong>rs. While it is not possible <strong>to</strong> isolate cause and effect, <strong>the</strong> fact that aircraft departures haveincreased by around 270 per cent between 1960 and 2005 is evidence of improvement in service frequency andconvenience.AIRPORT AND AIRSPACE CONGESTION29. During <strong>the</strong> 1980s, growth in passenger numbers of over 50 per cent and in aircraft departures of about35 per cent resulted in airport and airspace congestion in some regions. A pause in traffic growth and measures <strong>to</strong>increase capacity provided some relief in <strong>the</strong> early 1990s. However, <strong>the</strong> subsequent resumption of traffic growthin <strong>the</strong> late 1990s put pressure again on facilities. This came <strong>to</strong> a halt in <strong>the</strong> early 2000s, with <strong>the</strong> combination ofterrorist events and <strong>the</strong> general economic slowdown, which resulted in a delay of about five years in airport trafficgrowth. <strong>Air</strong> traffic growth has now resumed in most regions of <strong>the</strong> world and air traffic congestion has reemerged,increasing <strong>the</strong> pressure on capacity which is acute at some major airports. The land-intensivecharacteristics of airports and <strong>the</strong>ir environmental impact are serious barriers <strong>to</strong> <strong>the</strong> provision of extra runwaycapacity and, <strong>to</strong> a lesser extent, terminal capacity. Barriers <strong>to</strong> building new airport infrastructure may be of aregula<strong>to</strong>ry, political or environmental nature in addition <strong>to</strong> lack of funding and barriers <strong>to</strong> <strong>for</strong>eign investment.30. Technological developments and investment in aircraft, airports and air navigation equipment will createmore capacity in <strong>the</strong> air transport system <strong>to</strong> help meet future demand. A number of new airports, as well as airportexpansion projects, are due <strong>for</strong> completion over <strong>the</strong> next few years. Implementation of <strong>the</strong> global air trafficmanagement operational concept under <strong>the</strong> leadership of ICAO is expected <strong>to</strong> lead <strong>to</strong> significant improvements in<strong>the</strong> management of air traffic in all phases of flight.31. There are also various technical procedures, such as revisions <strong>to</strong> separation criteria, that can improve <strong>the</strong>flow of air traffic and reduce congestion delays. The provision of access and exit taxiways can increase runwaycapacity. In regard <strong>to</strong> congestion inside terminals, a number of States are reaching <strong>the</strong> goals of ICAO’s facilitationprogramme such as clearing all arriving passengers (requiring normal inspection) through international airportswithin 45 minutes. The progressive introduction of machine readable travel documents and <strong>the</strong> general streamliningof procedures will be of increasing importance in <strong>the</strong> continuing search <strong>for</strong> improvements.32. These measures are essentially supply-side oriented and can effectively increase <strong>the</strong> capacity of <strong>the</strong>infrastructure. O<strong>the</strong>r policies under consideration include pricing structures and regula<strong>to</strong>ry controls, such as slotallocation, which act on <strong>the</strong> demand side.33. The continuing development of high-speed rail services in Europe, in Japan and, <strong>to</strong> a limited extent, in<strong>the</strong> United States is expected <strong>to</strong> draw some air traffic from congested facilities.34. The increasing use of secondary airports in major urban areas and of regional airports is providing relief,as well as a degree of competition, <strong>to</strong> major airports by diverting traffic from high-density flows but, at <strong>the</strong> sametime, is adding aircraft movements, usually per<strong>for</strong>med by smaller aircraft, <strong>to</strong> air traffic management systems.
Chapter 2. <strong>Air</strong> <strong>Transport</strong> Trends and Challenges 17ENVIRONMENTAL PROTECTION35. Future growth in civil aviation will take place against a background of increasing public concernregarding <strong>the</strong> environment, particularly with regard <strong>to</strong> aircraft noise and <strong>the</strong> impact of aircraft engine emissions.36. Noise levels near airports are subject <strong>to</strong> two opposing trends: <strong>the</strong> replacement of noisy aircraft by quieterones and <strong>the</strong> increasing number of aircraft movements. ICAO has developed noise certification Standards(Annex 16, Volume I) and in 1990 adopted a worldwide policy enabling States <strong>to</strong> introduce operating restrictionson <strong>the</strong> older, noisier (“Chapter 2”) aircraft covered by <strong>the</strong>se Standards. The phase-out of Chapter 2 aircraft hasnow been completed at most airports where aircraft noise is a problem and governments have been turning <strong>the</strong>irattention <strong>to</strong> concerns that <strong>the</strong> rapid growth of air transport could increase noise levels once again. With a view <strong>to</strong>addressing <strong>the</strong>se concerns, ICAO endorsed <strong>the</strong> concept of a “balanced approach” <strong>to</strong> aircraft noise management.This consists of identifying <strong>the</strong> noise problem at an airport and <strong>the</strong>n analysing <strong>the</strong> various measures available <strong>to</strong>reduce noise through <strong>the</strong> exploration of four principal elements, namely reduction at source (quieter aircraft),land-use planning and management, noise abatement operational procedures, and operating restrictions, with <strong>the</strong>goal of addressing <strong>the</strong> noise problem in <strong>the</strong> most cost-effective manner. In 2006, a new, more stringent ICAOStandard (“Chapter 4”) became applicable.37. As regards aircraft engine emissions, initially <strong>the</strong> main concern was <strong>the</strong> impact on air quality in <strong>the</strong>vicinity of airports, as a result of which ICAO developed Standards <strong>for</strong> <strong>the</strong> control of gaseous emissions throughan engine certification scheme (Annex 16, Volume II). More recently, <strong>the</strong>re have been increasing concerns that<strong>the</strong>se emissions may be contributing <strong>to</strong> global atmospheric problems. The principal issue is aviation’scontribution <strong>to</strong> climate change. In 1999, <strong>the</strong> Intergovernmental Panel on Climate Change (IPCC) prepared aSpecial Report on Aviation and <strong>the</strong> Global Atmosphere 1 which estimated that aircraft contribute about 3.5 percent of <strong>the</strong> <strong>to</strong>tal radiative <strong>for</strong>cing 2 by all human activities. The emissions from aircraft of relevance <strong>for</strong> climatechange include carbon dioxide (CO 2 ), water vapour, nitrogen oxides (NO x ), sulphur oxides and soot.38. The Kyo<strong>to</strong> Pro<strong>to</strong>col <strong>to</strong> <strong>the</strong> UN Framework Convention on Climate Change (UNFCCC), which was adoptedin 1997 and entered in<strong>to</strong> <strong>for</strong>ce on 16 February 2005, requires industrialized countries <strong>to</strong> reduce <strong>the</strong>ir collectiveemissions of certain greenhouse gases, <strong>the</strong> one most relevant <strong>to</strong> aviation being CO 2 . The Kyo<strong>to</strong> Pro<strong>to</strong>col also calls<strong>for</strong> industrialized countries, working through ICAO, <strong>to</strong> limit or reduce emissions from international aviation.39. Future concerns about aviation’s role in both climate change and local air quality are largely due <strong>to</strong> <strong>the</strong>projected continued growth. Because of improvements in fuel productivity, growth rates <strong>for</strong> emissions are lessthan those <strong>for</strong> traffic growth. While fuel productivity improvement is expected <strong>to</strong> continue, <strong>the</strong>re are no easytechnical “fixes” <strong>for</strong> aviation and <strong>to</strong>tal emissions will continue <strong>to</strong> increase.FINANCIAL RESOURCES40. Investment in new aircraft generally follows a cyclical pattern. The latter part of <strong>the</strong> 1980s was a periodof high investment. Investment levels fell away during <strong>the</strong> recession of <strong>the</strong> early 1990s but began <strong>to</strong> build upagain in <strong>the</strong> latter part of <strong>the</strong> 1990s. As illustrated in Figure 2-10, aircraft orders tended <strong>to</strong> peak when <strong>the</strong> airtransport industry was profitable while peak deliveries coincided with financial deficits and low traffic growthleading <strong>to</strong> over-capacity and fur<strong>the</strong>r losses. There are signs however of a change in behavior and airlines maderecord aircraft orders in 2005 despite <strong>the</strong>ir net financial losses. The expected future funding requirement over <strong>the</strong>1. This Report has a Summary <strong>for</strong> Policymakers which is available in six UN languages (Arabic, Chinese, English, French, Russian andSpanish) and is accessible at IPCC’s Web site (www.ipcc.ch). The report itself (over 300 pages) is published in English only and can bepurchased from Cambridge University Press (www.cup.cam.ac.UK).2. Radiative <strong>for</strong>cing is a measure of <strong>the</strong> importance of a potential climate change mechanism.
18 <strong>Outlook</strong> <strong>for</strong> <strong>Air</strong> <strong>Transport</strong> <strong>to</strong> <strong>the</strong> <strong>Year</strong> <strong>2025</strong>long term is substantially larger, in real terms, than was required over comparable periods in <strong>the</strong> past. This isconsistent with <strong>the</strong> ongoing growth in traffic that is <strong>for</strong>ecast over <strong>the</strong> long term. In general, it is expected thatsufficient funding will be made available <strong>for</strong> <strong>the</strong> purchase or lease of aircraft and that <strong>the</strong> matching of supply <strong>to</strong>demand will improve over <strong>the</strong> <strong>for</strong>ecast horizon.ECONOMIC REGULATION41. For <strong>the</strong> past decade, <strong>the</strong>re have been significant developments in <strong>the</strong> air transport regula<strong>to</strong>ry scene at <strong>the</strong>national, bilateral, regional and multilateral levels. Much progress has been made in <strong>the</strong> liberalization ofinternational air transport.42. At <strong>the</strong> national level, <strong>the</strong>re has been a shift in <strong>the</strong> regula<strong>to</strong>ry approach, from detailed regulation of airlineoperations <strong>to</strong> relying more on market <strong>for</strong>ces. Several States have amended <strong>the</strong>ir air transport policies in light of<strong>the</strong> global trend <strong>to</strong>ward increased liberalization. Some of <strong>the</strong>se policies seek <strong>to</strong> liberalize air transport services, inwhole or in part, on a unilateral basis without requiring comparable rights from bilateral partners in return. O<strong>the</strong>rsaim at liberalizing domestic air transport markets and also at permitting more carriers <strong>to</strong> fly international routes.43. At <strong>the</strong> bilateral level, over 70 per cent of bilateral air services agreements which were recently concludedor amended contained some <strong>for</strong>m of liberalized arrangements such as unrestricted traffic rights (covering Third,Fourth and in some cases Fifth Freedom rights), multiple designation with or without route limitations, freedetermination of capacity, a liberal double disapproval or country-of-origin tariff regime, and broadened criteria<strong>for</strong> air carrier ownership and control. One notable development is <strong>the</strong> considerable increase in <strong>the</strong> number of“open skies” agreements, which provide <strong>for</strong> full market access without restrictions on designations, route rights,capacity, frequencies, codesharing and tariffs. Since <strong>the</strong> mid-1990s, over 120 such open skies agreements wereconcluded between some 90 States. These agreements involve not only developed countries but also an increasingnumber of developing countries (involved in about 65 per cent of <strong>the</strong> agreements).162 50012<strong>Air</strong>craf<strong>to</strong>rders1 900Per cent84<strong>Air</strong>craftdeliveries1 300700Number of aircraft0100Operating margin–41985 87 89 91 93 95 97 99 2001 2003 2005–500Figure 2-10. <strong>Air</strong>craft orders, deliveries and operating margin — World (1985–2005)
Chapter 2. <strong>Air</strong> <strong>Transport</strong> Trends and Challenges 1944. At <strong>the</strong> regional level, no less than 11 groups of States have created liberalization regimes on a regionalbasis or among a group of like-minded States; a few examples being <strong>the</strong> European Union (EU), <strong>the</strong> Andean Pact,<strong>the</strong> Yamoussoukro II Ministerial decision, and <strong>the</strong> Multilateral Agreement on <strong>the</strong> Liberalization of International<strong>Air</strong> <strong>Transport</strong>ation (MALIAT) known as <strong>the</strong> “Kona” open skies agreement. There are also several o<strong>the</strong>r potentialarrangements under development throughout <strong>the</strong> world. These regional and/or plurilateral liberalizationarrangements have <strong>the</strong> basic objective of providing greater market access and improving services among <strong>the</strong>member States concerned. Small groups of States of comparable size and development may find it easier <strong>to</strong> agreeon market access than larger, diverse groups of States. The small groups would also provide a more manageableenvironment <strong>to</strong> test liberalized air transport policies.45. Along with intra-regional liberalization, interaction between regions has also been on <strong>the</strong> rise. Moresignificantly, <strong>the</strong>re has been an increase in air service negotiations involving a regional grouping on <strong>the</strong> one hand,and a State or a group of States on <strong>the</strong> o<strong>the</strong>r. In this respect, EU has been <strong>the</strong> most active, where <strong>the</strong> EuropeanCommission now is engaged in such negotiations under specific mandates on behalf of all EU member States.This approach has led <strong>to</strong> <strong>the</strong> conclusion or negotiation of several liberalized arrangements (e.g. between <strong>the</strong> EUand <strong>the</strong> United States, <strong>the</strong> EU and Morocco, and between <strong>the</strong> Association of Sou<strong>the</strong>ast Asian Nations (ASEAN)and China). Such negotiations have introduced a new dimension <strong>to</strong> aviation relations between States.46. Because of such a continuing trend of liberalization in air transport regulation, in 2005, about 20 per cent of<strong>the</strong> country-pairs with non-s<strong>to</strong>p passenger air services and almost half of <strong>the</strong> seat capacity offered occurred betweenStates which have embraced liberalization ei<strong>the</strong>r by bilateral “open skies” air services agreements or by regionalliberalized agreements and arrangements (compared with less than 4 per cent and about 20 per cent respectively in1995).47. At <strong>the</strong> multilateral level, <strong>the</strong> World Trade Organization (WTO) came in<strong>to</strong> being in January 1995 when <strong>the</strong>General Agreement on Trade in Services (GATS) entered in<strong>to</strong> <strong>for</strong>ce. The GATS Annex on <strong>Air</strong> <strong>Transport</strong> Servicesapplies trade rules and principles such as most-favoured nation (MFN) treatment and national treatment <strong>to</strong> threespecific so-called “soft” rights, namely, aircraft repair and maintenance, selling and marketing of air transport, andcomputer reservation system (CRS) services. It excludes from <strong>the</strong> application of <strong>the</strong> GATS “services directly related<strong>to</strong> <strong>the</strong> exercise of traffic rights”. Pursuant <strong>to</strong> an earlier ministerial decision, WTO launched in 2000 <strong>the</strong> first reviewof <strong>the</strong> operation of this Annex with a view <strong>to</strong> considering possible extension of its coverage in <strong>the</strong> air transportsec<strong>to</strong>r. In 2003, however, <strong>the</strong> first review was concluded with <strong>the</strong> result that <strong>the</strong> Annex remains unchanged. In 2005,WTO launched its second round of review of <strong>the</strong> Annex on <strong>Air</strong> <strong>Transport</strong> Services.48. O<strong>the</strong>r more general regula<strong>to</strong>ry measures also affect air transport. Such measures include competition law,<strong>the</strong> imposition of various taxes, <strong>the</strong> expansion of airline responsibilities associated with national entry requirements(particularly <strong>for</strong> inadmissible passengers), more stringent health standards <strong>for</strong> entry particularly where prevention of<strong>the</strong> spread of Acquired Immune Deficiency Syndrome (AIDS) and Severe Acute Respira<strong>to</strong>ry Syndrome (SARS) ando<strong>the</strong>r contagious diseases is sought, and national narcotics control ef<strong>for</strong>ts.INDUSTRY STRUCTURE49. Traditionally, changes in airline industry structure arise from <strong>the</strong> need <strong>to</strong> meet growing demand <strong>for</strong> airtransport services in increasingly competitive but less regulated markets and a more globalized economicenvironment.50. Mega-carriers in <strong>the</strong> United States and elsewhere operate out of <strong>the</strong>ir home base airports applying <strong>the</strong> “huband spoke” system which employs large banks or complexes of interconnecting flights <strong>to</strong> maximize <strong>the</strong> number ofcity-pair markets that can be served by each flight. This operational approach arose from a perceived need <strong>to</strong> operateseveral hubs and <strong>to</strong> achieve critical mass (i.e. a volume sufficient <strong>to</strong> exploit economies of scope and density, and <strong>the</strong>ability <strong>to</strong> influence market conditions). However, <strong>the</strong> hub-and-spoke concept has recently come under scrutiny as
20 <strong>Outlook</strong> <strong>for</strong> <strong>Air</strong> <strong>Transport</strong> <strong>to</strong> <strong>the</strong> <strong>Year</strong> <strong>2025</strong>one of <strong>the</strong> measures taken by airlines <strong>to</strong> reduce airport services costs by utilizing staff, gates and aircraft moreproductively and <strong>to</strong> effectively compete with low cost carriers’(LCCs) point-<strong>to</strong>-point non-s<strong>to</strong>p operations.51. <strong>Air</strong>lines are making increased use of computer-based measures <strong>to</strong> improve productivity and optimizerevenues, including <strong>the</strong> use of au<strong>to</strong>mated systems <strong>for</strong> yield (or revenue) management and <strong>for</strong> marketing, sales andcommunication. The development of sophisticated yield management systems has enabled airlines <strong>to</strong> adjust <strong>the</strong>mix of high- and low-fare passengers on each flight in order <strong>to</strong> maximize revenues as well as <strong>to</strong> allocate seatsefficiently. Yield management has enabled established higher-cost airlines in certain instances <strong>to</strong> competeselectively with new LCCs that are often reliant upon low fares <strong>to</strong> achieve market penetration.Product distribution52. An important development in <strong>the</strong> airline distribution and sales area which combines computers andpersonal communication systems is direct sales <strong>to</strong> consumers, including via <strong>the</strong> Internet. Traditional travel agentsstill issue <strong>the</strong> majority of airline tickets, but online sales through airline websites and online travel agencies haveincreased significantly. This development has created new opportunities as well as challenges <strong>for</strong> airlines andCRS vendors. Many airlines have started or expanded online sales as a way of cutting distribution costs. Somehave joined <strong>for</strong>ces <strong>to</strong> create travel websites in order <strong>to</strong> maximize <strong>the</strong> benefits of electronic commerce. The fourglobal CRS vendors, Amadeus, Galileo, Sabre and Worldspan, have increasingly seen <strong>the</strong>mselves as globaldistribution systems (GDSs) and have pursued e-commerce businesses aggressively and acquired major onlinetravel agencies. There is also <strong>the</strong> emergence of some so-called GDS New Entrants (GNEs), which provide acheaper alternative <strong>to</strong> CRSs and have <strong>the</strong> potential <strong>to</strong> significantly reduce distribution costs <strong>for</strong> major airlines.53. Ano<strong>the</strong>r important development in this area is electronic ticketing, initially offered <strong>for</strong> domestic flights in<strong>the</strong> United States but now becoming widely available <strong>for</strong> international flights in all regions. IATA declared in2004 that <strong>the</strong> elimination of paper tickets and full implementation of e-ticketing worldwide would be achieved by<strong>the</strong> end of 2007. In an era of increased competition, <strong>the</strong>se developments offer considerable cost savings <strong>for</strong>airlines, as well as diversification of <strong>the</strong>ir distribution outlets.Alliances and airline cooperation54. The <strong>for</strong>mation of alliances as well as joint marketing arrangements among airlines is a relatively recent butrapidly evolving phenomenon implemented <strong>to</strong> achieve and improve market access (albeit indirectly) and synergies(<strong>for</strong> example, reducing <strong>the</strong> costs through network related economies of scope and scale). Currently, over 600 suchvoluntary strategic alliance agreements exist worldwide, containing a variety of elements such as codesharing,blocked space, cooperation in marketing, pricing, inven<strong>to</strong>ry control and frequent flyer programmes (FFPs),coordination in scheduling, sharing of offices and airport facilities, joint ventures and franchising. Among <strong>the</strong>transnational groupings, <strong>the</strong>re are three competing “global alliances”, namely Star Alliance, Oneworld and SkyTeam.Each group is composed of some major airline members having different geographical coverage with fairlyextensive networks. Through <strong>the</strong> alliances, <strong>the</strong>se carriers have combined <strong>the</strong>ir route networks, which extend <strong>to</strong> mostparts of <strong>the</strong> world, and <strong>to</strong>ge<strong>the</strong>r <strong>the</strong>y account <strong>for</strong> over 50 per cent of worldwide scheduled passenger traffic.55. These developments have caused concerns <strong>to</strong> small- and medium-size airlines <strong>for</strong> <strong>the</strong>ir survival and haveprompted ef<strong>for</strong>ts by <strong>the</strong>se airlines <strong>to</strong> specialize in serving particular segments of <strong>the</strong> market, <strong>to</strong> compete aslow-cost, point-<strong>to</strong>-point airlines or <strong>to</strong> enter various alliances of <strong>the</strong>ir own.<strong>Air</strong>line business models56. In recent years, successful LCCs have been challenging <strong>the</strong> full-service network airlines. The commonfeatures of <strong>the</strong> LCC business model are, with some variations: point-<strong>to</strong>-point network focusing on short-haul
Chapter 2. <strong>Air</strong> <strong>Transport</strong> Trends and Challenges 21routes, high frequencies, simple low-fare structures, high-density single class with no seat assignment, simplein-flight services, staffing flexibility and minimal overheads, and intensive use of electronic commerce <strong>for</strong>marketing and distribution (including online booking via <strong>the</strong> Internet and electronic ticketing). To sustainlow-cost structures, <strong>the</strong>se airlines usually operate a single aircraft type with high daily aircraft utilization. Theyalso use less-congested secondary airports <strong>to</strong> ensure quick turnarounds and punctuality and <strong>to</strong> reduceairport-related costs. Low operating costs enable LCCs <strong>to</strong> allocate all <strong>the</strong>ir seats <strong>to</strong> low fares. The growth of LCCshas prompted some larger airlines <strong>to</strong> create subsidiaries or separate units <strong>to</strong> compete with <strong>the</strong>m.57. In <strong>the</strong> area of air cargo, <strong>the</strong> highly sophisticated airline/parcel express delivery companies, which grewsubstantially in <strong>the</strong> past decade, continue <strong>to</strong> expand this specialized service. These companies operate large jetcargo fleets combined with surface delivery systems <strong>to</strong> provide continental overnight deliveries and second dayintercontinental services via strategically placed sorting hubs. This concept has also been adopted by a number ofpostal administrations.Privatization, national consolidation and transnational ownership58. Privatization of State-owned airlines has been one of <strong>the</strong> preeminent trans<strong>for</strong>mations in international airtransport, where airlines in all but a handful of States had been State-owned until recently. The motives <strong>for</strong>privatization have been highly diverse, ranging from purely economic considerations, or attempts <strong>to</strong> improveoperating efficiency and competitiveness, <strong>to</strong> a more pragmatic desire <strong>to</strong> reduce <strong>the</strong> heavy financial burden <strong>for</strong>States <strong>for</strong> financing capital investment in new equipment. Whatever <strong>the</strong> reasons, <strong>the</strong> privatization of airlines hasaccompanied a more commercially-oriented outlook within an increasingly competitive environment. Since 1985,about 135 States have announced privatization plans or expressed <strong>the</strong>ir intentions of privatization <strong>for</strong> over 205State-owned airlines. During this period, about 125 of <strong>the</strong>se targeted carriers have achieved privatization goals.59. <strong>Air</strong>lines in many parts of <strong>the</strong> world have continued <strong>the</strong> pursuit of <strong>the</strong> perceived advantages of enhancedmarket strength through mergers, acquisitions or operational integration under a single holding company. Thecommon thread of this trend is <strong>the</strong> continuing development of growth strategies designed <strong>to</strong> hold and expandexisting market share, gain access <strong>to</strong> new markets, achieve unit cost reduction, shield <strong>the</strong>mselves againstcompetition, and increase <strong>the</strong> scale of operations in order <strong>to</strong> attain a critical market position. The notable recentcases were <strong>the</strong> creation of a cross-border European airline group between <strong>Air</strong> France and KLM under a singleholding company in 2004, a phased acquisition of Swiss by Lufthansa, through <strong>Air</strong>Trust, in 2005 and a fullacquisition of Avianca by Brazilian owned Synergy Group in 2005. Mergers or acquisitions are easier <strong>to</strong> achievewithin <strong>the</strong> same country, although some Governments have expressed concerns regarding industry consolidationand have scrutinized it closely.60. The opportunity <strong>for</strong> equity investment in <strong>for</strong>eign carriers has increased as many States adopted newpolicies or amended existing rules on <strong>for</strong>eign investment or control in national airlines and relaxed air carrierownership and control conditions in air services agreements. However, most attempts <strong>to</strong> initiate transactionsinvolving a <strong>for</strong>eign majority ownership, including cross-border mergers or acquisitions, were abandoned owing <strong>to</strong>aeropolitical, economic and regula<strong>to</strong>ry complexities. Even in <strong>the</strong> implemented cases, <strong>the</strong> control and managemen<strong>to</strong>f <strong>for</strong>eign carriers were not financially risk-free. Because of <strong>the</strong>se difficulties in successful implementation, most<strong>for</strong>eign investments in <strong>the</strong> airline industry have been on a limited scale, instead of taking a majority stake orpursuing a full-scale merger, and often as part of a strategy <strong>to</strong> <strong>for</strong>ge or streng<strong>the</strong>n alliances and expand marketaccess. Never<strong>the</strong>less, <strong>for</strong>eign investments have sometimes been short-lived._____________________
Chapter 3WORLD ECONOMIC ENVIRONMENTHISTORICAL TRENDS1. As indicated in Chapter 2, <strong>the</strong> world economy is subject <strong>to</strong> economic cycles but has steadily grown over<strong>the</strong> long term. During <strong>the</strong> period 1960–2005, <strong>the</strong> aggregate world economy measured in terms of GDP increasedat an average annual rate of 3.9 per cent in real terms.2. Following <strong>the</strong> slowdown of 1980–1982, <strong>the</strong> world economy experienced its longest period of sustainedprogress (1983–1990) since <strong>the</strong> Second World War, achieving an average annual growth rate of 4.0 per cent be<strong>for</strong>e aslowdown in 1991, due primarily <strong>to</strong> fuel price increases in <strong>the</strong> wake of <strong>the</strong> Gulf crisis.3. However, <strong>the</strong> 1990 oil price increases did less damage <strong>to</strong> <strong>the</strong> world economy than did previous increasesin 1973 and 1980. The 1990 increases were smaller, and <strong>the</strong> ability of <strong>the</strong> economies of <strong>the</strong> industrializedcountries <strong>to</strong> cope with <strong>the</strong>m was greater because of reduced energy dependency and <strong>the</strong> effects of structuralre<strong>for</strong>ms in <strong>the</strong> 1980s. They also lasted <strong>for</strong> a shorter period, with both crude oil and jet fuel prices returning <strong>to</strong>pre-crisis levels by March 1991.4. World economic growth, measured in terms of real GDP, declined from 3.8 per cent in 1989 <strong>to</strong> 3.0 per centin 1990. In 1991, some major economies entered in<strong>to</strong> a recession or experienced a slowdown; as a result, <strong>the</strong> worldeconomy increased only by 1.7 per cent in 1991, <strong>the</strong> most difficult year globally since 1982. The world economyimproved in 1992 and 1993, and over <strong>the</strong> period 1990–1995 it grew at an average annual rate of 2.5 per cent. Havingexperienced high growth rates in 1996 and 1997 (4.1 and 4.2 per cent, respectively), <strong>the</strong> world economy sloweddown in 1998, led by a downturn in <strong>the</strong> Asia/Pacific region, and increased only by 2.8 per cent. It regained strength,however, in 1999 with GDP growth of 3.7 per cent, based mainly on economic recovery in <strong>the</strong> Asia/Pacific regionand continued strong growth in <strong>the</strong> United States economy, and continued <strong>to</strong> grow in 2000 at 4.9 per cent. Ano<strong>the</strong>rslowdown occurred during 2001 across almost all major regions resulting from a marked decline in trade growth,significantly lower commodity prices, and deteriorating financing conditions in emerging markets. The events of11 September 2001 amplified <strong>the</strong> impact of an already weakening global economy, particularly on consumer andbusiness confidence in <strong>the</strong> United States; as a result, GDP growth dropped <strong>to</strong> 2.6 per cent. With trade, industrialproduction and private consumption improving across all regions, <strong>the</strong> world economy recovered its strength andgrew at a rate of 3.1 per cent and 4.1 per cent in 2002 and 2003, respectively. The growth momentum continued in2004 and 2005, with increases of 5.3 and 4.9 per cent respectively, helped in part by a robust service sec<strong>to</strong>rper<strong>for</strong>mance despite <strong>the</strong> sustained increase in oil prices.5. World population between 1985 and 2005 increased at an average annual rate of 1.5 per cent. Hence, <strong>the</strong>world’s GDP per capita increased during <strong>the</strong> same period at an average annual rate of 2.2 per cent, lower than <strong>the</strong>growth of GDP itself. For <strong>the</strong> period 1995–2005, GDP and GDP per capita grew at an average annual rate of4.0 per cent and 2.7 per cent, respectively.6. Figure 3-1 portrays <strong>the</strong> his<strong>to</strong>rical growth trends of GDP and GDP per capita in real terms from 1985–2005and shows that since <strong>the</strong> end of <strong>the</strong> economic slowdown of <strong>the</strong> early nineties, GDP per capita has been growing.22
Chapter 3. World Economic Environment 236GDPGDP per capita4Per cent201985 87 89 91 93 95 97 99 2001 2003 2005Source: ICAO estimates based on data from IMF, World Bank and o<strong>the</strong>r sources.Figure 3-1. Growth of real GDP and GDP per capita — World (1985–2005)OUTLOOK7. Despite some concerns about <strong>the</strong> short-term prospects <strong>for</strong> some regions and expectations that oil priceswill likely remain at <strong>the</strong>ir current levels, <strong>the</strong>re appears <strong>to</strong> be consensus among economic <strong>for</strong>ecasters that <strong>the</strong>global economy will continue <strong>to</strong> expand over <strong>the</strong> medium and long terms. The world GDP growth in 2006 isestimated at 5.1 per cent in real terms and it is anticipated <strong>to</strong> continue in 2007 and 2008 at <strong>the</strong> rates of 4.9 and4.8 per cent, respectively.8. Over <strong>the</strong> long-term horizon <strong>to</strong> <strong>2025</strong>, <strong>the</strong> world economy is projected <strong>to</strong> grow at an average annual rate of3.5 per cent in real terms (see Chapter 5). This projected growth rate is slightly lower than <strong>the</strong> actual rate <strong>for</strong> <strong>the</strong>past 20 years. The economies of <strong>the</strong> Asia/Pacific region are expected <strong>to</strong> grow at an average of 4 per cent perannum. Excluding Japan, <strong>the</strong> region is anticipated <strong>to</strong> register <strong>the</strong> highest growth of 5.7 per cent per annum mainlydriven by <strong>the</strong> economies of China and India whose share in <strong>the</strong> world economy is expected <strong>to</strong> double by <strong>2025</strong> due<strong>to</strong> an expanding middle class and <strong>the</strong> growth in export-oriented industries and services. The economies of <strong>the</strong>African and <strong>the</strong> Latin America and Caribbean regions are expected <strong>to</strong> grow at about 5 per cent and 4 per cent perannum, respectively, benefiting from <strong>the</strong> implementation of re<strong>for</strong>ms aiming at achieving improved fiscal balances,establishing a more effective institutional framework and an increased integration with <strong>the</strong> world economythrough trade and investment. The economies of <strong>the</strong> Middle East region are expected <strong>to</strong> grow at about 4.2 percent per annum, helped by oil exports, economic re<strong>for</strong>ms and diversification. The more mature economies of <strong>the</strong>North American and European regions are expected <strong>to</strong> grow at about 3 per cent and 2.5 per cent per annumrespectively._____________________
Chapter 4AIRLINE FINANCIAL TRENDSOPERATING REVENUES, EXPENSES AND RESULTSGlobal trends1. This chapter outlines general trends in airline financial data (in current terms unless indicated o<strong>the</strong>rwise)from <strong>the</strong> his<strong>to</strong>rical perspective and, in broad terms, <strong>the</strong> outlook <strong>to</strong> <strong>the</strong> year <strong>2025</strong>. Five-year-interval financial data<strong>for</strong> <strong>the</strong> period 1965–2005, categorized by major components of operating revenues and expenses, are given inTable 4-1. The trends in annual operating revenues and expenses <strong>for</strong> <strong>the</strong> period 1985 <strong>to</strong> 2005 are illustrated inFigure 4-1. The treatment is global in nature, dealing with <strong>to</strong>tals and averages <strong>for</strong> <strong>the</strong> airlines at <strong>the</strong> global level,and <strong>for</strong> this reason does not show <strong>the</strong> wide differences that exist between regions or individual carriers. Since <strong>the</strong>available in<strong>for</strong>mation on non-scheduled opera<strong>to</strong>rs is incomplete, <strong>the</strong> analysis is confined <strong>to</strong> <strong>the</strong> scheduled airlinesof ICAO Contracting States (although <strong>the</strong> non-scheduled operations of <strong>the</strong>se airlines are included).2. The long-term his<strong>to</strong>rical trend of <strong>the</strong> financial per<strong>for</strong>mance of scheduled airlines indicates nei<strong>the</strong>r animprovement nor a decline. Fluctuations in <strong>the</strong> operating results over <strong>the</strong> past twenty years appear <strong>to</strong> be cyclical.During <strong>the</strong> 1983–1989 period, a decrease in fuel costs, along with o<strong>the</strong>r cost reduction and yield control measures,brought about an improvement in <strong>the</strong> financial results of <strong>the</strong> industry which generated a positive net result of 4.4per cent of operating revenues over this period. This trend was reversed in 1990 as a result of a steep increase infuel prices caused by <strong>the</strong> Gulf crisis, along with a slowdown in <strong>the</strong> world economy. The market conditionschanged as <strong>the</strong> demand weakened and <strong>the</strong> utilization of airline resources tended <strong>to</strong> decline. The emergence ofexcess capacity and consequent competitive pressures put downward pressure on yields. These fac<strong>to</strong>rs combined<strong>to</strong> produce negative operating results in three consecutive years (1990–1992). In 1993, <strong>the</strong> airline industry started<strong>to</strong> move <strong>to</strong>wards a more appropriate balance of supply and demand and achieved a small operating surplus.Between 1994 and 2000, <strong>the</strong> airline industry continued <strong>to</strong> show positive operating results with profit marginsranging between 3.1 and 5.6 per cent of operating revenues. In 2001, shrinking operating revenues, due <strong>to</strong>declining traffic combined with increasing fuel, security and insurance costs, led <strong>to</strong> an unprecedented operationalloss of $11.8 billion and a net loss of $13 billion. <strong>Air</strong>lines continued <strong>to</strong> suffer operational losses in 2002 and 2003due <strong>to</strong> <strong>the</strong> buildup <strong>to</strong> <strong>the</strong> war in Iraq and its aftermath and <strong>to</strong> <strong>the</strong> outbreak of <strong>the</strong> SARS epidemic. An impressivetraffic recovery in 2004 and 2005 accompanied with a measured capacity response led <strong>to</strong> positive operatingresults in those years while net results remained negative (see Table 4-1).3. As shown in Table 4-2, from 1985 <strong>to</strong> 2005 <strong>the</strong> <strong>to</strong>tal operating revenues of <strong>the</strong> world’s scheduled airlinesfrom scheduled and non-scheduled services (including incidental revenues) increased at an average annual rate of6.7 per cent, from $112 200 million <strong>to</strong> $413 300 million. During <strong>the</strong> same period, <strong>the</strong> corresponding <strong>to</strong>taloperating expenses increased at an average annual rate of 6.9 per cent, from $108 100 million <strong>to</strong> $409 000 million.During this period, <strong>the</strong> growth in world airline operating revenues was associated with an average annual growthin <strong>to</strong>tal traffic of 6.2 per cent in terms of TKPs (excluding domestic operations in <strong>the</strong> Russian Federation in 1985)and an increase in airline yields (average operating revenue per <strong>to</strong>nne-kilometre per<strong>for</strong>med) of 0.5 per cent perannum from 72 cents in 1985 <strong>to</strong> 80.2 cents in 2005. The unit cost per available <strong>to</strong>nne-kilometre (ATK) increasedby 1.1 per cent per annum from 40.3 cents in 1985 <strong>to</strong> 49.7 cents in 2005. Figure 4-2 presents <strong>the</strong> trends in <strong>the</strong>financial per<strong>for</strong>mance indica<strong>to</strong>rs of <strong>the</strong> global airline industry in terms of unit revenues and costs as well asoperating and net results over <strong>the</strong> 1985–2005 period.24
Table 4-1. Operating revenues and expenses -- World (1965-2005)(Total services of scheduled airlines of ICAO Contracting States 1 )1965 1970 1975 1980 1985 1990 1995 2000 2001 2002 2003 2004 2005 2(millions of dollars)OPERATING REVENUESScheduled services (<strong>to</strong>tal) 7 881 16 466 35 166 80 003 102 000 173 970 233 660 284 920 267 550 265 910 279 320 328 420 360 190Passenger 6 748 14 097 30 174 69 290 87 000 153 330 205 000 248 940 232 410 231 030 242 320 285 970 315 970Freight 755 1 745 4 196 9 293 13 300 18 410 25 980 33 840 32 990 32 740 34 750 40 180 42 150Mail 378 624 796 1 420 1 700 2 230 2 680 2 140 2 150 2 140 2 250 2 270 2 070Non-scheduled operations 358 805 1 612 3 260 3 500 7 090 10 680 11 710 10 470 9 790 9 980 11 740 10 340Incidental 195 546 1 513 4 413 6 700 18 440 22 660 31 870 29 480 30 300 32 500 38 600 42 770Total operating revenues 8 434 17 817 38 309 87 676 112 200 199 500 267 000 328 500 307 500 306 000 321 800 378 760 413 300OPERATING EXPENSESFlight operations (<strong>to</strong>tal) 1 971 4 651 12 215 33 768 34 930 56 320 66 550 98 790 97 020 95 700 102 840 125 800 154 190Flight crew salaries and expenses 705 1 796 3 292 6 424 7 250 13 780 19 450 26 380 27 840 27 960 29 760 31 920 31 900<strong>Air</strong>craft fuel and oil 944 1 944 7 305 24 524 23 780 30 300 28 970 45 900 42 950 40 400 43 950 61 210 89 570O<strong>the</strong>r (insurance, rental,training, etc.) 322 911 1 618 2 820 3 900 12 240 18 130 26 510 26 230 27 340 29 130 32 670 32 720Maintenance and overhaul 1 331 2 476 4 688 9 079 11 070 22 900 26 810 33 710 36 120 35 130 34 910 39 430 41 720Depreciation and amortization 845 1 899 3 065 5 457 7 770 13 850 18 400 20 780 22 670 22 190 21 330 23 660 24 950User charges and station expenses(<strong>to</strong>tal) 1 199 2 908 6 351 13 364 17 340 32 460 46 140 54 720 54 000 52 860 54 950 61 970 66 260Landing and associated airportcharges 212 530 1 424 3 069 3 540 7 730 11 440 13 490 12 660 12 440 12 930 14 650 15 540O<strong>the</strong>r 987 2 378 4 927 10 295 13 800 24 730 34 700 41 230 41 340 40 420 42 020 47 320 50 720Passenger services 647 1 714 3 514 7 963 10 310 20 710 28 070 31 780 32 670 31 710 32 330 36 420 38 040Ticketing, sales and promotion 1 183 2 643 5 491 12 634 18 470 32 860 39 590 40 450 35 650 33 260 32 330 36 430 37 220General, administrative ando<strong>the</strong>r operating expenses 450 1 076 2 255 6 055 8 210 21 900 27 940 37 570 41 170 40 050 44 610 51 790 46 620Total operating expenses 7 626 17 367 37 579 88 310 108 100 201 000 253 500 317 800 319 300 310 900 323 300 375 500 409 000Operating result [profit or loss (!)] 808 450 730 –634 4 100 –1 500 13 500 10 700 –11 800 –4 900 –1 500 3 260 4 300Operating result as a percentage ofoperating revenues 9.6 2.5 1.9 –0.7 3.7 0.7 5.1 3.3 –3.8 –1.6 -0.5 0.9 1.0Net result 488 –27 –67 –919 2 100 –4 500 4 500 3 700 –13 000 –11 300 –7 560 –5 670 –4 100Net result as a percentageof operating revenues 5.8 –0.2 –0.2 –1.0 1.9 –2.3 1.7 1.1 –4.2 –3.7 –2.3 –1.5 –1.01. Excludes domestic operations of airlines registered in <strong>the</strong> USSR prior <strong>to</strong> 1992 and <strong>the</strong> Russian Federation from 1992–1997.2. Preliminary data.Source: ICAOChapter 4. <strong>Air</strong>line Financial Trends 25
26 <strong>Outlook</strong> <strong>for</strong> <strong>Air</strong> <strong>Transport</strong> <strong>to</strong> <strong>the</strong> <strong>Year</strong> <strong>2025</strong>450 000400 000RevenuesExpenses350 000$ (millions)300 000250 000200 000150 000100 00050 00001985 87 89 91 93 95 97 99 2001 2003 2005Source: ICAO Reporting Form EF.Note.— Excluding domestic operations of airlines registered in <strong>the</strong> Russian Federation prior <strong>to</strong> 1996.Figure 4-1. Scheduled airline operating revenues and expenses — World (1985–2005)Table 4-2. Total and unit operating revenues and expenses — World (1985 and 2005)(Total services of scheduled airlines of ICAO Contracting States)Operatingrevenues($ millions)Operatingexpenses($ millions)Totaltraffic(TKP millions)Unitrevenue(cents/TKP)Totalcapacity(ATK millions)Unitcost(cents/ATK)1985 1 112 200 108 100 155 940 72.0 268 260 40.32005 413 300 409 000 515 540 80.2 823 250 49.7Average annual growth2005/1985 (per cent)6.7 6.9 6.2 0.5 5.8 1.11. Excluding domestic operations of airlines registered in <strong>the</strong> <strong>for</strong>mer USSR.Source: ICAO Reporting Forms A and EF.
Chapter 4. <strong>Air</strong>line Financial Trends 2710080Revenue per TKPExpense per TKPU.S. cents6040Expense per ATK2001985 87 89 91 93 95 97 99 2001 2003 2005864Operating result as apercentage of revenuesPer cent20–2–4Net result as apercentage of revenues–61985 87 89 91 93 95 97 99 2001 2003 2005Source: ICAO Reporting Form EF.Note.— Excluding domestic operations of airlines registered in <strong>the</strong> Russian Federation prior <strong>to</strong> 1996.Figure 4-2. Financial per<strong>for</strong>mance indica<strong>to</strong>rs of scheduled airlines — World (1985–2005)
28 <strong>Outlook</strong> <strong>for</strong> <strong>Air</strong> <strong>Transport</strong> <strong>to</strong> <strong>the</strong> <strong>Year</strong> <strong>2025</strong>Yields and unit costs4. His<strong>to</strong>rically, airline fares have reflected <strong>the</strong> trends in operating costs and changing competitive conditions.<strong>Air</strong>line yields have declined in real terms almost every year since <strong>the</strong> advent of jet aircraft. The reductions in faresand freight rates, expressed in real terms, that occurred between 1975 and 2005 are reflected in real declines inpassenger revenue per passenger-kilometre and freight revenue per freight <strong>to</strong>nne-kilometre. These declines inyield contributed substantially <strong>to</strong> traffic growth. Marketing of air transport was aided by <strong>the</strong> fact that airfaresrepresented a steadily improving bargain in comparison with many o<strong>the</strong>r services. Figure 4-3 illustrates <strong>the</strong>annual change in average passenger yield over <strong>the</strong> 1975–2005 period as well as <strong>the</strong> annual change in freight yield.Average world passenger yield measured in real terms decreased at a rate of 2.6 per cent per annum, while freightand mail yield decreased at a rate of 3.5 per cent per annum over that period. These declines in yield were <strong>the</strong>result of technological advances, longer average trip lengths, greater competition and certain economies of scale.5. Measured in real terms, <strong>the</strong> operating costs per available <strong>to</strong>nne-kilometre (ATK) of world scheduledairlines declined on average by 2.0 per cent per annum over <strong>the</strong> 1975–2005 period, with year-<strong>to</strong>-year fluctuationsillustrated in Figure 4-4.1610012Passenger yield(left-hand scale)75Revenue per PKP8Freight yield(right-hand scale)50Revenue per TKP425001975 78 81 84 87 90 93 96 99 2002 2005Source: ICAO Reporting Form EF.Note.— Excluding domestic operations of airlines registered in <strong>the</strong> USSR prior <strong>to</strong> 1992 and <strong>the</strong>Russian Federation from 1992 <strong>to</strong> 1996.Figure 4-3. Passenger and freight yields of scheduled airlines — World (1975–2005)(U.S. cents in real terms)
Chapter 4. <strong>Air</strong>line Financial Trends 2984<strong>Air</strong>line unit cost(left-hand scale)9060Change in cost/ATK (%)0–4300Change in fuel price (%)–8Fuel price(right-hand scale)–30–12–601975 78 81 84 87 90 93 96 99 2002 2005Source: ICAO Reporting Forms A and EF, US Department of Energy.Note.— Excluding domestic operations of airlines registered in <strong>the</strong> Russian Federation prior <strong>to</strong> 1996.Figure 4-4. Changes in unit operating costs ofscheduled airlines and fuel prices — World (1975–2005)(U.S. cents per ATK in real terms)6. <strong>Air</strong>line operating costs are heavily influenced by jet fuel prices. Due <strong>to</strong> large increases in oil prices in1979, unit costs rose sharply in 1980 with fuel costs accounting <strong>for</strong> almost 29 per cent of <strong>the</strong> <strong>to</strong>tal costs ofscheduled airlines. Unit costs declined during <strong>the</strong> period 1982–1985 partly as a result of declining fuel prices. Theshare of aircraft fuel and oil costs in <strong>to</strong>tal operating costs varies in tandem with fuel prices as illustrated inFigure 4-5, Following <strong>the</strong> sharp increases in oil prices in <strong>the</strong> years 2004 and 2005, <strong>the</strong> share of fuel and oil costsregained its 1985 level after remaining confined within <strong>the</strong> 10 <strong>to</strong> 15 per cent range over <strong>the</strong> period in between In<strong>the</strong> absence of hedging, short-term variations in fuel prices would have an immediate impact on unit costs <strong>for</strong>cing<strong>the</strong> airlines <strong>to</strong> look <strong>for</strong> alternative cost reduction measures or pass <strong>the</strong> costs <strong>to</strong> <strong>the</strong> passenger through higher fares.In <strong>the</strong> long term, fuel prices are expected <strong>to</strong> remain within <strong>the</strong> range of 40 <strong>to</strong> 60 dollars per barrel and <strong>the</strong>irpressure on costs is expected <strong>to</strong> remain at its current level. In addition <strong>to</strong> aircraft fuel costs, o<strong>the</strong>r fac<strong>to</strong>rs that havean important impact on unit costs include aircraft utilization and capacity.Operating revenues and expenses by category and region7. When comparing 1985 and 2005, as presented in Table 4-3, <strong>the</strong> share of revenues from scheduled servicesdeclined more than 3 percentage points and accounted <strong>for</strong> nearly 87 per cent of <strong>to</strong>tal operating revenues in 2005,while that of incidental revenues (which cover sales of services and maintenance, leasing of aircraft <strong>to</strong> o<strong>the</strong>r airlinesand o<strong>the</strong>r non-core transport-related activities) jumped <strong>to</strong> 10 per cent. But this distribution has broadly been about<strong>the</strong> same since <strong>the</strong> early 1990s.
30 <strong>Outlook</strong> <strong>for</strong> <strong>Air</strong> <strong>Transport</strong> <strong>to</strong> <strong>the</strong> <strong>Year</strong> <strong>2025</strong>30Real oil price(right-hand scale)50Per cent241812Fuel and oil share inoperating cost(left-hand scale)61001985 87 89 91 93 95 97 99 2001 2003 2005 0403020Constant 2000 U.S.$ per barrelSource: ICAO Reporting Forms A and EF, US Department of Energy.Note.— Excluding domestic operations of airlines registered in <strong>the</strong> Russian Federation prior <strong>to</strong> 1996.Figure 4-5. Share of fuel and oil in operating expenses ofscheduled airlines — World (1985–2005)8. Considering <strong>the</strong> two major categories of airline operating expenses, direct expenses accounted <strong>for</strong> about54 per cent of <strong>the</strong> <strong>to</strong>tal in 2005 while indirect expenses made up <strong>the</strong> remaining 46 per cent, compared <strong>to</strong> 49.7 and50.3 per cent, respectively, in 1985. The major part of <strong>the</strong> direct expenses, i.e. <strong>to</strong>tal flight operations expenses,increased by over 5 percentage points between 1985 and 2005, mainly because of significant increases in “o<strong>the</strong>r”expenses which include rental of flight equipment expenses, reflecting <strong>the</strong> increasing use of leasing arrangementsby <strong>the</strong> airline industry over <strong>the</strong> period concerned Among <strong>the</strong> indirect expenses, “general, administrative and o<strong>the</strong>roperating expenses” rose by 3.8 percentage points, while “ticketing, sales and promotion” fell by 8 percentagepoints during <strong>the</strong> same period (see Chapter 2, paragraphs 52 and 53 regarding cost savings on this item).9. Estimates of <strong>the</strong> distribution of <strong>to</strong>tal operating revenues and expenses according <strong>to</strong> <strong>the</strong> region of airlineregistration are given, <strong>to</strong>ge<strong>the</strong>r with <strong>the</strong> corresponding operating results, in Table 4-4 <strong>for</strong> 1985 and 2005. In 2005,about 36 per cent of operating revenues and operating expenses of <strong>the</strong> world’s airlines were attributable <strong>to</strong> NorthAmerican airlines, some 31 per cent of revenues and expenses <strong>to</strong> European airlines and some 22 per cent ofrevenues and expenses <strong>to</strong> airlines of Asia/Pacific, with <strong>the</strong> remaining 11 per cent of revenues and expenses, dividedamong those of Africa, <strong>the</strong> Middle East and Latin America/Caribbean. Compared <strong>to</strong> 1985, <strong>the</strong> 2005 shares ofoperating revenues and expenses of <strong>the</strong> airlines of Europe and Asia/Pacific represented a gain of some 6 and 5percentage points of <strong>the</strong> world <strong>to</strong>tal, respectively, while those of <strong>the</strong> North American carriers declined by about 9percentage points in both revenues and expenses. The shares of <strong>the</strong> airlines of <strong>the</strong> remaining regions declinedmarginally.
Chapter 4. <strong>Air</strong>line Financial Trends 31Table 4-3. Distribution of operating revenues and expenses — World (1985 and 2005)(Total services of scheduled airlines of ICAO Contracting States)Distribution by category(per cent)Change in per centshare of item1985 1 2005 1985 <strong>to</strong> 2005OPERATING REVENUESScheduled services (<strong>to</strong>tal) 90.9 87.2 –3.7Passenger 77.5 76.5 –1Freight 11.9 10.2 –1.7Mail 1.5 0.5 –1Non-scheduled operations 3.1 2.5 –0.6Incidental 6.0 10.3 4.3TOTAL 100.0 100.0 —OPERATING EXPENSESDirect aircraftFlight operations (<strong>to</strong>tal) 32.3 37.7 5.4Flight crew 6.7 7.8 1.1Fuel and oil 22.0 21.9 –0.1O<strong>the</strong>r 3.6 8.0 4.4Maintenance and overhaul 10.2 10.2 0Depreciation and amortization 7.2 6.1 –1.1Sub<strong>to</strong>tal 49.7 54 4.3IndirectUser charges and station expenses (<strong>to</strong>tal) 16.1 16.2 0.1Landing and associated airport charges 3.3 3.8 0.5O<strong>the</strong>r 12.8 12.4 –0.4Passenger services 9.5 9.3 –0.2Ticketing, sales, promotion 17.1 9.1 -8General, administrative and o<strong>the</strong>r 7.6 11.4 3.8Sub<strong>to</strong>tal 50.3 46 –4.3TOTAL 100.0 100.0 —1. Excluding domestic operations of airlines registered in <strong>the</strong> <strong>for</strong>mer USSR.Source: ICAO <strong>Air</strong> <strong>Transport</strong> Reporting Forms A and EF.
32 <strong>Outlook</strong> <strong>for</strong> <strong>Air</strong> <strong>Transport</strong> <strong>to</strong> <strong>the</strong> <strong>Year</strong> <strong>2025</strong>Table 4-4. Distribution of operating revenues and expenses —Regions of airline registration (1985 1 and 2005)(Total services of scheduled airlines of ICAO Contracting States)<strong>Year</strong>Operating revenues Operating expenses Operating resultDollars(millions)Per cen<strong>to</strong>f worldDollars(millions)Per cen<strong>to</strong>f worldDollars(millions)Per cent ofoperatingrevenuesAfrica 1985 3 840 3.4 3 890 3.6 –50 –1.32005 9 400 2.3 9 760 2.4 –360 –3.8Asia and Pacific 1985 19 100 17.0 18 100 16.8 1 000 5.22005 92 200 22.3 90 740 22.2 1 460 1.6Europe 1985 27 800 24.8 26 400 24.4 1 400 5.02005 129 780 31.4 126 800 31.0 2 980 2.3Latin America and Caribbean 1985 5 530 4.9 5 500 5.1 30 0.52005 17 370 4.9 17 230 5.1 140 0.8Middle East 1985 5 200 4.7 5 100 4.7 100 1.92005 16 320 3.9 15 950 3.9 370 2.3North America 1985 50 730 45.2 49 110 45.4 1 620 3.22005 148 180 35.9 148 460 36.3 –280 –0.2World 2 1985 112 200 100.0 108 100 100.0 4 100 3.72005 413 300 100.0 409 000 100.0 4 310 1.01. Excluding domestic operations of airlines registered in <strong>the</strong> <strong>for</strong>mer USSR.2. World <strong>to</strong>tals have been rounded <strong>to</strong> <strong>the</strong> nearest hundred.Source: ICAO Digests of Statistics, Series F — Financial Data.OUTLOOK10. The prospects <strong>for</strong> airline yields are closely related <strong>to</strong> cost developments and market conditions in <strong>the</strong>airline industry. Faced with increasing competition, airlines had <strong>to</strong> define and implement aggressive cost-cuttingand productivity-improvement measures with particular focus on ticketing, sales and promotion (notably inconnection with product distribution), and general/administrative expenses. While some cost items are not under<strong>the</strong>ir direct control, such as fuel prices and user charges, airlines have put significant pressure on suppliers <strong>to</strong>improve <strong>the</strong>ir efficiency. Over <strong>the</strong> <strong>for</strong>ecast period 2005–<strong>2025</strong>, <strong>the</strong> airline industry is likely <strong>to</strong> continue improvingefficiency through productivity gains, but unit costs are not expected <strong>to</strong> fall significantly fur<strong>the</strong>r due <strong>to</strong> fac<strong>to</strong>rssuch as fuel, labour and capital.11. Over this <strong>for</strong>ecast period average passenger yields (fares) as well as average freight yields (rates) areexpected <strong>to</strong> remain constant in real terms._____________________
Chapter 5FORECASTS OF AIRLINE TRAFFICTO THE YEAR <strong>2025</strong>FORECASTING METHODOLOGY1. As a basis <strong>for</strong> <strong>the</strong> preparation of <strong>the</strong> traffic <strong>for</strong>ecasts <strong>for</strong> this study, econometric analyses were carried ou<strong>to</strong>f <strong>the</strong> effects of underlying fac<strong>to</strong>rs on <strong>the</strong> his<strong>to</strong>ric aggregate demands <strong>for</strong> scheduled passenger and freight traffic.These analyses were used <strong>to</strong> translate expectations of future world economic development and future trends ininternational trade and average fares in<strong>to</strong> projections of future traffic demand.2. More detailed projections <strong>for</strong> international and domestic scheduled traffic <strong>for</strong> <strong>the</strong> airlines of eachgeographical region were initially developed from <strong>the</strong> <strong>for</strong>ecasts of <strong>to</strong>tal scheduled traffic by analysing his<strong>to</strong>rictraffic trends and market shares <strong>for</strong> <strong>the</strong> airlines, based on <strong>the</strong> individual geographical regions. These projectionswere reviewed in light of economic trends and o<strong>the</strong>r fac<strong>to</strong>rs relevant <strong>to</strong> particular regions.3. The procedures described above relate <strong>to</strong> traffic <strong>for</strong>ecasts in terms of passenger-kilometres per<strong>for</strong>med andfreight <strong>to</strong>nne-kilometres per<strong>for</strong>med. In addition, <strong>for</strong>ecasts of <strong>the</strong> number of passengers carried and freight <strong>to</strong>nnescarried were prepared <strong>for</strong> <strong>to</strong>tal scheduled international and domestic services. These were derived from <strong>the</strong> <strong>for</strong>ecastsof passenger-kilometres and <strong>to</strong>nne-kilometres on <strong>the</strong> basis of expectations of future trends in <strong>the</strong> average length ofhaul <strong>for</strong> <strong>the</strong> various types of services.4. Forecasts of passenger-kilometres achieved by scheduled airlines on major route groups were alsodeveloped. For a particular group of routes, <strong>the</strong> traffic <strong>for</strong>ecasts <strong>to</strong>ok in<strong>to</strong> account economic developments in <strong>the</strong>regions at ei<strong>the</strong>r end of <strong>the</strong> route as well as o<strong>the</strong>r fac<strong>to</strong>rs pertinent <strong>to</strong> <strong>the</strong> particular route group, such as his<strong>to</strong>ricaltraffic trends and demographics.MAIN ASSUMPTIONS AND ECONOMETRIC MODELS5. The following are <strong>the</strong> main assumptions concerning trends, over <strong>the</strong> period 2005 <strong>to</strong> <strong>2025</strong>, in <strong>the</strong> fac<strong>to</strong>rsthat underlie traffic growth:a) a “most likely” average rate of world economic growth of 3.5 per cent per annum (in real terms);b) moderate growth in world trade at a “most likely” average rate of about 5.5 per cent per annum;c) no change in average passenger yields (fares) and in freight yields (rates) in real terms <strong>for</strong> <strong>the</strong> worldas a whole; andd) availability of adequate capital resources <strong>for</strong> <strong>the</strong> development of aviation and <strong>to</strong>urist infrastructure.6. On <strong>the</strong> basis of his<strong>to</strong>rical data, several econometric models were developed <strong>for</strong> scheduled passengertravel demand, <strong>for</strong> freight traffic demand as well as <strong>for</strong> various route groups wherever possible.33
34 <strong>Outlook</strong> <strong>for</strong> <strong>Air</strong> <strong>Transport</strong> <strong>to</strong> <strong>the</strong> <strong>Year</strong> <strong>2025</strong>7. The econometric models developed <strong>for</strong> predicting demand in terms of <strong>to</strong>tal world scheduledpassenger-kilometres per<strong>for</strong>med and <strong>to</strong>tal world freight <strong>to</strong>nne-kilometres are described in Appendix 1. The firstmodel provided estimates of <strong>the</strong> effect on scheduled passenger travel of changes in world GDP and averagepassenger fare levels (both in real terms), and <strong>the</strong> second provided estimates of <strong>the</strong> effect on scheduled freighttransport of changes in world exports and average freight rate levels (in real terms).GLOBAL PASSENGER FORECASTS8. Inserting <strong>the</strong> above economic and yield assumptions in<strong>to</strong> <strong>the</strong>se models resulted in growth rates <strong>for</strong> <strong>the</strong>period 2005–<strong>2025</strong> <strong>for</strong> world scheduled traffic of 4.6 per cent per annum <strong>for</strong> passenger-kilometres. In view of <strong>the</strong>recent traffic trends and expectations of future developments of <strong>the</strong> underlying fac<strong>to</strong>rs, this growth rate has beendeemed as a fair representation of future traffic growth up <strong>to</strong> <strong>2025</strong>, barring any un<strong>for</strong>eseen events of significance.9. As in <strong>the</strong> past, year-<strong>to</strong>-year growth is likely <strong>to</strong> fluctuate considerably. As an indication of <strong>the</strong> sensitivity oftraffic growth <strong>to</strong> alternative assumptions about economic growth and trends in passenger yields, a “low” passengertraffic <strong>for</strong>ecast of 2.6 per cent per annum results from assumptions of 2.5 per cent per annum average growth ofGDP in real terms and an increase in real fares (yield) of 2.0 per cent per annum during <strong>the</strong> <strong>for</strong>ecast horizon. A“high” <strong>for</strong>ecast of 6.2 per cent per annum results from assumptions of 4.5 per cent per annum <strong>for</strong> economic growthand an average annual decline in real fares of –1.0 per cent. The “most likely”, “low” and “high” trends areillustrated in Figure 5-1. The “low” and “high” series depict <strong>the</strong> extreme cases beyond which it is unlikely thattraffic would fall. Under reasonable assumptions about future conditions affecting <strong>the</strong> industry, <strong>the</strong> actual outcome isexpected <strong>to</strong> lie close <strong>to</strong> <strong>the</strong> central <strong>for</strong>ecast.10. International scheduled passenger traffic (in PKPs) is <strong>for</strong>ecast <strong>to</strong> grow at an average rate of 5.3 per centper annum compared with 3.4 per cent per annum <strong>for</strong> domestic scheduled passenger traffic, as shown in Table 5-1and also illustrated in Figure 5-1. The slower growth of domestic traffic results from <strong>the</strong> fact that 62 per cent ofall domestic scheduled traffic is accounted <strong>for</strong> by <strong>the</strong> already highly developed domestic system in <strong>the</strong> UnitedStates where growth rates are expected <strong>to</strong> be moderate.11. Forecasts of scheduled passenger traffic in terms of <strong>the</strong> number of passengers carried are also given inTable 5-1. Growth in terms of world scheduled passengers carried is expected <strong>to</strong> be somewhat lower than growthin passenger-kilometres because <strong>the</strong> latter includes <strong>the</strong> effect of an anticipated increase in <strong>the</strong> average passengerjourney distance at an annual rate of 0.5 per cent. The number of passengers carried is projected <strong>to</strong> reach some4.5 billion worldwide by <strong>2025</strong>.12. The increase in <strong>the</strong> average passenger journey distance <strong>for</strong> international traffic had been pronounced in<strong>the</strong> sixties and seventies, but has become modest during <strong>the</strong> 1985–2005 period. As a result, <strong>the</strong> growth ofpassengers carried on international services was slightly below <strong>the</strong> growth of passenger-kilometres during <strong>the</strong>same period. It is expected that <strong>the</strong> growth in average international passenger journey would remain almostunchanged during <strong>the</strong> <strong>for</strong>ecast period, and <strong>the</strong> number of passengers carried on scheduled international serviceswill reach close <strong>to</strong> 2 billion by <strong>the</strong> year <strong>2025</strong>.13. Putting <strong>the</strong> expected growth in passenger traffic in perspective, <strong>the</strong> passenger-kilometres per<strong>for</strong>med andpassengers carried are expected <strong>to</strong> more than double between 2005 and <strong>2025</strong>. In absolute terms, <strong>the</strong> increase inpassenger-kilometres during <strong>the</strong> <strong>for</strong>ecast period is expected <strong>to</strong> be some 5 460 billion, which is more than twice<strong>the</strong> 2 355 billion increase during <strong>the</strong> period 1985–2005. The absolute increase in passengers carried is projected <strong>to</strong>be slightly below 2.5 billion by <strong>2025</strong>, compared with about 1.13 billion between 1985 and 2005.
Chapter 5. Forecasts of <strong>Air</strong>line Traffic <strong>to</strong> <strong>the</strong> <strong>Year</strong> <strong>2025</strong> 3514 000ACTUAL12 000Passenger-kilometres (billions)10 0008 0006 0004 0002 000TotalInternationalHigh (6.2% p.a.)Most likely (4.6% p.a.)Low (2.6% p.a.)01985878991939597992001Domestic20032005Figure 5-1. Trends in scheduled passenger traffic — World (1985–<strong>2025</strong>)(ICAO Contracting States)2015<strong>2025</strong>Table 5-1. ICAO scheduled passenger traffic <strong>for</strong>ecasts — World (1985–<strong>2025</strong>)(ICAO Contracting States)Actual Actual ForecastAverage annual growth rate(per cent)1985 2005 <strong>2025</strong> 1985–2005 2005–<strong>2025</strong>Passenger-kilometres (billions)Scheduled services 1 365 3 720 9 180 5.1 4.6International 589 2 198 6 225 6.8 5.3Domestic 776 1 522 2 955 3.4 3.4Passengers carried (millions)Scheduled services 896 2 022 4 500 4.2 4.1International 194 704 1 950 6.7 5.2Domestic 702 1 318 2 550 3.2 3.4Source: ICAO.
36 <strong>Outlook</strong> <strong>for</strong> <strong>Air</strong> <strong>Transport</strong> <strong>to</strong> <strong>the</strong> <strong>Year</strong> <strong>2025</strong>REGIONAL PASSENGER FORECASTS14. The “most likely” <strong>for</strong>ecasts of scheduled airline passenger traffic by region of airline registration are givenin Table 5-2, <strong>to</strong>ge<strong>the</strong>r with his<strong>to</strong>rical figures <strong>for</strong> 1985 and 2005. The airlines of <strong>the</strong> Middle East and Asia/Pacificregions are expected <strong>to</strong> show <strong>the</strong> highest growth in passenger traffic, at 5.8 per cent per annum through <strong>to</strong> <strong>the</strong> year<strong>2025</strong>, while <strong>the</strong> airlines of North America are anticipated <strong>to</strong> show <strong>the</strong> lowest growth, around 3.6 per cent per annum.Traffic of <strong>the</strong> airlines of <strong>the</strong> African and <strong>the</strong> Latin America/Caribbean regions are expected <strong>to</strong> grow at 5.1 per centand 4.8 per cent per annum respectively, whereas traffic of European airlines is <strong>for</strong>ecast <strong>to</strong> grow at 4.3 per cent,below <strong>the</strong> world average.Table 5-2. ICAO scheduled passenger traffic — Regions of airline registration (1985–<strong>2025</strong>)(ICAO Contracting States)Passenger-kilometres(billions)Actual2005Actual1985Average annual growthrate (per cent)Regional share of worldtraffic (per cent)Forecast<strong>2025</strong> 1985–2005 2005–<strong>2025</strong> 1985 2005 <strong>2025</strong>AfricaTotal 36.7 84.8 230 4.3 5.1 2.7 2.3 2.5International 28.5 72.2 205 4.8 5.4 4.8 3.3 3.3Domestic 8.2 12.6 25 2.2 3.5 1.1 0.8 0.8Asia/PacificTotal 222.3 967.4 2 980 7.6 5.8 16.3 26.0 32.5International 150.3 622.5 2 100 7.4 6.3 25.5 28.3 33.7Domestic 72.0 344.9 880 8.1 4.8 9.3 22.7 29.8EuropeTotal 428.2 1 004.9 2 350 4.4 4.3 31.4 27.0 25.6International 214.4 865.9 2 160 7.2 4.7 36.4 39.4 34.7Domestic 213.8 139.0 190 –2.1 1.6 27.5 9.1 6.4Latin America/CaribbeanTotal 68.3 159.2 410 4.3 4.8 5.0 4.3 4.5International 36.5 95.1 260 4.9 5.2 6.2 4.3 4.2Domestic 31.8 64.1 150 3.6 4.3 4.1 4.2 5.1Middle EastTotal 42.7 168.9 520 7.1 5.8 3.1 4.5 5.7International 35.1 152.5 480 7.6 5.9 6.0 6.9 7.7Domestic 7.6 16.4 40 3.9 4.6 1.0 1.1 1.4North AmericaTotal 567.4 1 334.5 2 690 4.4 3.6 41.5 35.9 29.3International 124.5 389.2 1 020 5.9 4.9 21.1 17.7 16.4Domestic 442.9 945.3 1 670 3.9 2.9 57.1 62.1 56.5WorldTotal 1 365.6 3 719.7 9 180 5.1 4.6 100.0 100.0 100.0International 589.3 2 197.4 6 225 6.8 5.3 100.0 100.0 100.0Domestic 776.3 1 522.3 2 955 3.4 3.4 100.0 100.0 100.0Source: ICAO.Note.— Shares may not add up <strong>to</strong> 100 per cent due <strong>to</strong> rounding.
Chapter 5. Forecasts of <strong>Air</strong>line Traffic <strong>to</strong> <strong>the</strong> <strong>Year</strong> <strong>2025</strong> 3715. As a result of <strong>the</strong> projected growth in passenger traffic, <strong>the</strong> airlines of <strong>the</strong> Asia/Pacific region areexpected <strong>to</strong> increase <strong>the</strong>ir share of world passenger traffic (in terms of passenger-kilometres) by about6.5 percentage points <strong>to</strong> 32.5 per cent, <strong>the</strong> highest among all <strong>the</strong> regions, with <strong>the</strong>ir share of <strong>to</strong>tal internationalscheduled passenger traffic increasing <strong>to</strong> about 33.7 per cent.16. A significant change in regional share is expected <strong>to</strong> occur in North America, whose airlines’ share isanticipated <strong>to</strong> decline by about 6.6 percentage points <strong>to</strong> 29.3 per cent by <strong>the</strong> year <strong>2025</strong>. The shares of internationaland domestic scheduled traffic of North America are expected <strong>to</strong> decrease, but <strong>the</strong> region will still hold <strong>the</strong>highest share of world domestic traffic at 56.5 per cent. The shares of <strong>the</strong> European airlines are also expected <strong>to</strong>decline but <strong>the</strong>ir share in international scheduled traffic will remain <strong>the</strong> highest. Changes in <strong>the</strong> shares of airlinesof o<strong>the</strong>r regions are anticipated <strong>to</strong> be small.PASSENGER FORECASTS BY ROUTE GROUP17. Following <strong>the</strong> overall decline in traffic in 2001 and <strong>the</strong> modest per<strong>for</strong>mance in 2002 and 2003, mostinternational route groups recovered <strong>the</strong>ir 2000 traffic levels in 2004, led by <strong>the</strong> Europe-Asia/Pacific and Intra-Europe route groups. The recovery of <strong>the</strong> North Atlantic and Trans-Pacific route groups did not materialize until<strong>the</strong> year 2005, given <strong>the</strong> difficulties faced by U.S. carriers and <strong>the</strong> restructuring and capacity redeployment thatensued.18. The traffic <strong>for</strong>ecasts, originally developed at <strong>the</strong> global level, were disaggregated <strong>to</strong> <strong>the</strong> major routegroups level (Table 5-3) on <strong>the</strong> basis of <strong>the</strong> most recent his<strong>to</strong>rical per<strong>for</strong>mance and <strong>the</strong> expectations about futuregrowth. All international route groups are anticipated <strong>to</strong> grow at average rates ranging from 3.5 per cent <strong>to</strong> 6.6 percent per annum over <strong>the</strong> <strong>for</strong>ecast time horizon. The fastest growing route groups are those <strong>to</strong>, from and within <strong>the</strong>Asia/Pacific region due <strong>to</strong> <strong>the</strong> expectations of relatively high economic and <strong>to</strong>urism growth <strong>for</strong> <strong>the</strong> region and itsexpanding middle class. Routes between Europe and Africa, Europe and <strong>the</strong> Middle East and Intra Africa are alsoexpected <strong>to</strong> grow at similar rates owing <strong>to</strong> <strong>the</strong>ir lower base and <strong>the</strong> anticipated faster economic growth <strong>for</strong> NorthAmerica and <strong>the</strong> Middle East. Average growth rates on all domestic route groups will vary from 2.5 per cent perannum <strong>for</strong> North America <strong>to</strong> 5.4 <strong>for</strong> Africa.GLOBAL FREIGHT FORECASTS19. The econometric analysis, <strong>to</strong>ge<strong>the</strong>r with <strong>the</strong> assumptions mentioned earlier, resulted in a “most likely”projected growth rate of 6.6 per cent per annum <strong>for</strong> world scheduled freight <strong>to</strong>nne-kilometres <strong>for</strong> <strong>the</strong> period 2005–<strong>2025</strong>. This is about <strong>the</strong> same growth registered <strong>for</strong> <strong>the</strong> 1985–2005 period. Alternative assumptions concerning <strong>the</strong>underlying fac<strong>to</strong>rs affecting air freight suggest a band of <strong>for</strong>ecast growth rates ranging from a “low” of 4.9 percent per annum <strong>to</strong> a “high” of 7.8 per cent per annum as illustrated in Figure 5-2.20. Table 5-4 presents <strong>the</strong> ICAO <strong>for</strong>ecasts of scheduled freight traffic (including international and domesticcomponents) in terms of both <strong>to</strong>nne-kilometres per<strong>for</strong>med and <strong>to</strong>nnes carried. International freight traffic isexpected <strong>to</strong> grow more rapidly than domestic freight traffic, due partly <strong>to</strong> <strong>the</strong> relatively fast growth ofinternational commerce. Domestic freight is dominated by <strong>the</strong> more mature market of <strong>the</strong> United States, and thisis ano<strong>the</strong>r reason <strong>for</strong> <strong>the</strong> moderate growth of <strong>to</strong>tal domestic traffic. Freight <strong>to</strong>nnes carried are expected <strong>to</strong> growmore slowly than freight <strong>to</strong>nne-kilometres because of a continuing increase in <strong>the</strong> average length of haul.
38 <strong>Outlook</strong> <strong>for</strong> <strong>Air</strong> <strong>Transport</strong> <strong>to</strong> <strong>the</strong> <strong>Year</strong> <strong>2025</strong>Table 5-3. ICAO air traffic <strong>for</strong>ecasts — Route groups (1985–<strong>2025</strong>)(ICAO Contracting States)Passenger-kilometres per<strong>for</strong>med (billion)Actual1985Actual2005Average annual growthrate (per cent)Forecast<strong>2025</strong> 1985–2005 2005–<strong>2025</strong>International scheduled servicesMid-Atlantic 11.0 58.2 154 8.7 5.0North Atlantic 139.9 434.9 1 049 5.8 4.5South Atlantic 12.5 69.4 210 8.9 5.7Trans-Pacific 67.4 262.5 842 7.0 6.0Between Europe and Africa 37.6 121.8 363 6.0 5.6Between Europe and Asia/Pacific 69.2 263.9 815 6.9 5.8Between Europe and Middle East 25.0 73.2 235 5.5 6.0Between Middle East and Asia/Pacific 23.0 98.4 355 7.5 6.6Between North America and CentralAmerica/Caribbean 21.5 63.1 152 5.5 4.5Between North America and SouthAmerica 13.1 59.8 159 7.9 5.0Intra Africa 4.6 13.4 43 5.5 6.0Intra Asia/Pacific 70.5 295.8 949 7.4 6.0Intra Europe 60.5 253.3 555 7.4 4.0Intra Latin America 8.0 22.6 72 5.3 6.0Intra Middle East 4.5 15.0 44 6.2 5.5Intra North America 15.0 27.4 55 3.0 3.5O<strong>the</strong>r international routes 5.9 65.3 173 12.8 5.0Total international 589.3 2 198.0 6 225 6.8 5.3Domestic scheduled servicesAfrica 8.1 12.6 36 2.2 5.4Asia/Pacific 72.0 344.9 933 8.1 5.1Europe 213.8 139.0 228 –2.1 2.5Latin America 31.8 64.1 169 3.6 5.0Middle East 7.5 16.4 40 4.0 4.6North America 442.9 945.3 1 549 3.9 2.5Total domestic 776.2 1 522.3 2 955 3.4 3.4Global (international + domestic) 1 365.5 3 720.3 9 180 5.1 4.6Note.— The his<strong>to</strong>rical database has been developed from several sources, including ICAO and IATA.
Chapter 5. Forecasts of <strong>Air</strong>line Traffic <strong>to</strong> <strong>the</strong> <strong>Year</strong> <strong>2025</strong> 39Freight <strong>to</strong>nne-kilometres (millions)650 000520 000390 000260 000130 0000198587899193959799TotalACTUALInternationalDomestic200120032005FORECASTFigure 5-2. Trends in scheduled freight traffic — World (1985–<strong>2025</strong>)(ICAO Contracting States)2015High (7.8% p.a.)Most likely (6.6% p.a.)Low (4.9% p.a.)<strong>2025</strong>Table 5-4. ICAO scheduled freight traffic <strong>for</strong>ecasts — World (1985–<strong>2025</strong>)(ICAO Contracting States)Average annual growth rate(per cent)Actual Actual Forecast1985 2005 <strong>2025</strong> 1985-2005 2005-<strong>2025</strong>Freight <strong>to</strong>nne-kilometres (millions)Total 39 813 142 580 510 000 6.6 6.6International 29 384 118 480 452 120 7.2 6.9Domestic 10 429 24 100 57 880 4.3 4.5Freight <strong>to</strong>nnes carried (thousands)Total 13 742 37 660 145 000 5.2 5.5International 5 884 22 630 110 000 7.0 6.5Domestic 7 858 15 030 35 000 3.3 3.4Source: ICAO.
40 <strong>Outlook</strong> <strong>for</strong> <strong>Air</strong> <strong>Transport</strong> <strong>to</strong> <strong>the</strong> <strong>Year</strong> <strong>2025</strong>REGIONAL FREIGHT FORECASTS21. The “most likely” <strong>for</strong>ecasts of scheduled freight traffic by region of airline registration are presented inTable 5-5. The regional pattern of growth is ra<strong>the</strong>r similar <strong>to</strong> that <strong>for</strong> passenger traffic. Asia/Pacific and <strong>the</strong>Middle East are expected <strong>to</strong> remain <strong>the</strong> fastest growing regions, although <strong>the</strong>ir <strong>for</strong>ecast growth rates aresomewhat lower than <strong>the</strong> growth rates achieved during <strong>the</strong> 1985–2005 period.Table 5-5. ICAO scheduled freight traffic — Regions of airline registration (1985–<strong>2025</strong>)(ICAO Contracting States)Freight <strong>to</strong>nne-kilometres(millions)Actual2005Actual1985Forecast<strong>2025</strong>Average annualgrowth rate(per cent)1985–2005Regional share of worldtraffic (per cent)2005–<strong>2025</strong> 1985 2005 <strong>2025</strong>AfricaTotal 1 163 2 349 6 000 3.6 4.8 2.9 1.6 1.2International 1 070 2 256 5 870 3.8 4.9 3.6 1.9 1.3Domestic 93 93 130 0.0 1.7 0.9 0.4 0.2Asia/PacificTotal 9 605 50 105 235 000 8.6 8.0 24.1 35.1 46.1International 8 589 45 070 215 000 8.6 8.1 29.2 38.0 47.6Domestic 1 016 5 035 20 000 8.3 7.1 9.7 20.9 34.6EuropeTotal 14 422 37 875 97 000 4.9 4.8 36.2 26.6 19.0International 11 589 36 981 95 900 6.0 4.9 39.4 31.2 21.2Domestic 2 833 894 1 100 –5.6 1.0 27.2 3.7 1.9Middle EastTotal 1 880 8 880 40 000 8.1 7.8 4.7 6.2 7.8International 1 808 8 764 39 750 8.2 7.9 6.2 7.4 8.8Domestic 72 116 250 2.4 3.9 0.7 0.5 0.4North AmericaTotal 10 638 38 803 120 000 6.7 5.8 26.7 27.2 23.5International 4 841 21 634 85 000 7.8 7.1 16.5 18.3 18.8Domestic 5 797 17 169 35 000 5.6 3.6 55.6 71.2 60.5Latin America/CaribbeanTotal 2 105 4 567 12 000 3.9 4.9 5.3 3.2 2.4International 1 487 3 777 10 600 4.8 5.3 5.1 3.2 2.3Domestic 618 790 1 400 1.2 2.9 5.9 3.3 2.4WorldTotal 39 813 142 579 510 000 6.6 6.6 100.0 100.0 100.0International 29 384 118 482 452 120 7.2 6.9 100.0 100.0 100.0Domestic 10 429 24 097 57 880 4.3 4.5 100.0 100.0 100.0Source: ICAO.Note.— Shares may not add up <strong>to</strong> 100 per cent due <strong>to</strong> rounding.
Chapter 5. Forecasts of <strong>Air</strong>line Traffic <strong>to</strong> <strong>the</strong> <strong>Year</strong> <strong>2025</strong> 4122. By <strong>the</strong> year <strong>2025</strong>, airlines of <strong>the</strong> Asia/Pacific region are expected <strong>to</strong> increase <strong>the</strong>ir share of air freighttraffic by more than 10 percentage points <strong>to</strong> slightly over 46 per cent of <strong>to</strong>tal world freight, a share well abovethat of any o<strong>the</strong>r region.ACCURACY OF PREVIOUS FORECASTS23. Previous ICAO <strong>for</strong>ecasts tended <strong>to</strong> somewhat overestimate <strong>the</strong> actual passenger traffic growth whichremained never<strong>the</strong>less within <strong>the</strong> <strong>for</strong>ecast margins, while freight traffic growth <strong>for</strong>ecasts mostly matched <strong>the</strong>actuals. The accuracy of <strong>the</strong> most recent <strong>for</strong>ecasts published in 2001 and 2004 could not be assessed given that<strong>the</strong>ir time horizon extends <strong>to</strong> 2010 and 2015, respectively. The accuracy of <strong>the</strong> o<strong>the</strong>r sets of ICAO long-termpassenger and freight <strong>for</strong>ecasts is depicted in Figures 5-3 and 5-4. The last set of <strong>for</strong>ecasts shown on both figureswas developed in 1997. Despite several un<strong>for</strong>eseen events including <strong>the</strong> Asian economic crisis in <strong>the</strong> second halfof 1997, <strong>the</strong> events of 11 September 2001, <strong>the</strong> war in Iraq and <strong>the</strong> SARS epidemic in 2003, actual passengertrafficgrowth <strong>for</strong> <strong>the</strong> period 1995–2005 was very close <strong>to</strong> <strong>the</strong> most likely <strong>for</strong>ecast, due in part <strong>to</strong> <strong>the</strong> speedyrecovery in 2004 and 2005. This was not <strong>the</strong> case <strong>for</strong> actual freight traffic growth which was close <strong>to</strong> <strong>the</strong> low<strong>for</strong>ecast.SUMMARY OF AIR TRAFFIC FORECASTSBY OTHER ORGANIZATIONS24. Some recent long-term <strong>for</strong>ecasts by major airframe and engine manufacturers of growth in worldscheduled traffic are given in Table 5-6. These <strong>for</strong>ecast growth rates are in <strong>the</strong> range of 4.8 <strong>to</strong> 5.0 per cent perannum <strong>for</strong> passenger-kilometres, with freight <strong>to</strong>nne-kilometres generally <strong>for</strong>ecast <strong>to</strong> grow at a slightly higher rate<strong>for</strong> <strong>the</strong> period ranging from 2005 <strong>to</strong> 2026.2016Actual High Low LikelyGrowth (%)1284Forecast period01967–80 1970– 80 1982– 92 1985– 95 1988– 2000 1992– 2003 1995–2005Forecast publication 1968 1971 1983 1986 1989 1995 1997Figure 5-3. ICAO <strong>for</strong>ecast accuracy (growth of passenger-kilometres per<strong>for</strong>med)
42 <strong>Outlook</strong> <strong>for</strong> <strong>Air</strong> <strong>Transport</strong> <strong>to</strong> <strong>the</strong> <strong>Year</strong> <strong>2025</strong>2418Actual High Low LikelyGrowth (%)1260Forecast period1967– 80 1970– 80 1982– 92 1985– 95 1988– 2000 1992– 2003 1995–2005Forecast publication 1968 1971 1983 1986 1989 1995 1997Figure 5-4. ICAO <strong>for</strong>ecast accuracy (growth of freight <strong>to</strong>nne-kilometres)Table 5-6. Global scheduled traffic <strong>for</strong>ecastsby aerospace manufacturersForecastperiodAverage annual growth rate(per cent)PassengerkilometresFreight <strong>to</strong>nnekilometres<strong>Air</strong>bus Industrie 2006–<strong>2025</strong> 4.8 6.0Boeing 2005–<strong>2025</strong> 4.9 —Embraer 2007-2026 5.0 —Rolls-Royce 2006–<strong>2025</strong> 4.8 6.8Source: <strong>Air</strong>bus Industrie, "Global Market Forecast”, 2006; Boeing Commercial <strong>Air</strong>planes, “Current Market<strong>Outlook</strong>”, 2006; Rolls-Royce, “The <strong>Outlook</strong>”, 2006.25. Forecasts developed by <strong>the</strong> <strong>Air</strong>port Council International (ACI) <strong>for</strong> <strong>the</strong> period 2006–<strong>2025</strong> indicateaverage annual growth rates of 4 per cent and 5.4 per cent in <strong>the</strong> <strong>to</strong>tal number of passengers and freight <strong>to</strong>nnes,respectively.26. Separate <strong>for</strong>ecasts (medium-term only) <strong>for</strong> <strong>the</strong> number of passengers carried and passenger-kilometresper<strong>for</strong>med on world international services by member airlines, are regularly prepared by <strong>the</strong> International <strong>Air</strong><strong>Transport</strong> Association (IATA). The most recent <strong>for</strong>ecasts, covering <strong>the</strong> 2006–2010 period, indicate an averagegrowth of 4.8 per cent per annum <strong>for</strong> passengers and 5.3 per cent per annum <strong>for</strong> freight <strong>to</strong>nnes._____________________
Chapter 6FORECASTS OF AIRCRAFT MOVEMENTSTO THE YEAR <strong>2025</strong>FACTORS AFFECTING AIRCRAFT MOVEMENTS1. The planning of aviation facilities and <strong>the</strong> development of aviation policies require assessment of futuretrends in aircraft movements as well as of passenger and freight traffic flows. This is becoming increasinglyimportant because of concerns over airport and airspace congestion in some regions. <strong>Air</strong>craft movements havegrown steadily during most of <strong>the</strong> past decade, increasing <strong>the</strong> pressure on airport and air navigation services. Poortraffic per<strong>for</strong>mance in <strong>the</strong> years 2001, 2002 and 2003 has somewhat eased this pressure in <strong>the</strong> regions concerned,but with <strong>the</strong> traffic recovery observed since <strong>the</strong>n, airport and airspace congestion have built up again.2. The primary fac<strong>to</strong>r affecting <strong>the</strong> number of aircraft movements is <strong>the</strong> demand <strong>for</strong> passenger travel. Thepassenger traffic <strong>for</strong>ecasts presented in <strong>the</strong> previous chapter are, <strong>the</strong>re<strong>for</strong>e, key inputs <strong>to</strong> <strong>the</strong> aircraft movement<strong>for</strong>ecasts.3. When passenger demand increases, air carriers can respond by scheduling extra flights, by using largeraircraft, or by managing higher load fac<strong>to</strong>rs. During <strong>the</strong> 1970s, air carriers accommodated most of <strong>the</strong> growth indemand by introducing larger aircraft. As a result of both increasing aircraft size and improving load fac<strong>to</strong>rs, <strong>the</strong>growth in aircraft movements remained quite small despite rapid growth in passenger traffic. However, in <strong>the</strong>1980s, <strong>the</strong> trend in average aircraft size remained almost unchanged as airlines began <strong>to</strong> introduce more mid-sizeand smaller aircraft in<strong>to</strong> <strong>the</strong>ir fleets. From <strong>the</strong> early 1990s, <strong>the</strong> average aircraft size began <strong>to</strong> decrease and inrecent years, <strong>the</strong> decline has been more pronounced. Past trends in average aircraft size and average load fac<strong>to</strong>r<strong>for</strong> <strong>to</strong>tal world scheduled services are illustrated in Figure 6-1.4. Gradual improvements in average load fac<strong>to</strong>rs have resulted from marketing initiatives, enhanced capacitymanagement and revenue management programmes. During <strong>the</strong> period 2001–2003 some markets experiencedexceptionally low load fac<strong>to</strong>rs due <strong>to</strong> traffic declines, but load fac<strong>to</strong>rs improved substantially in <strong>the</strong> years 2004 and2005 as a result of a measured supply response <strong>to</strong> <strong>the</strong> increase in traffic through tight capacity control. It is expectedthat <strong>the</strong> world average scheduled passenger load fac<strong>to</strong>r, which increased from 63 per cent in 1985 <strong>to</strong> 75 per cent in2005, will rise <strong>to</strong> about 80 per cent by <strong>2025</strong>.5. The services provided by carriers <strong>to</strong> meet demand result from a large number of decisions concerningnetwork structure, aircraft types and service frequency. These decisions depend on fac<strong>to</strong>rs such as <strong>the</strong> availabilityof traffic rights, <strong>the</strong> characteristics of alternative aircraft, and consumer preferences and trade-offs between priceand service quality. Despite <strong>the</strong> complexity of this process, it is possible <strong>to</strong> discern several key fac<strong>to</strong>rs which arein part responsible <strong>for</strong> <strong>the</strong> observed change in <strong>the</strong> trend in average aircraft seating capacity and hence <strong>the</strong>relationship between traffic demand and aircraft movements.6. The first of <strong>the</strong>se fac<strong>to</strong>rs is <strong>the</strong> trend <strong>to</strong>wards liberalization or deregulation in some important markets.Deregulation in <strong>the</strong> United States domestic airline markets began in 1978, followed by gradual liberalization ofair services within <strong>the</strong> European Union. The evolution of competitive strategies and market structures hascontinued since <strong>the</strong>n. Adequate frequency and convenient interline and online connections, as well as low price,have become important competitive <strong>to</strong>ols. A more liberal regula<strong>to</strong>ry environment has also emerged gradually ino<strong>the</strong>r domestic markets and in international markets. The consequent increased priority given <strong>to</strong> frequency anddirect service has tended <strong>to</strong> increase <strong>the</strong> number of aircraft movements required <strong>to</strong> satisfy a given level of demand.43
44 <strong>Outlook</strong> <strong>for</strong> <strong>Air</strong> <strong>Transport</strong> <strong>to</strong> <strong>the</strong> <strong>Year</strong> <strong>2025</strong>7. The second fac<strong>to</strong>r is <strong>the</strong> arrival of new, mid-size, high-technology aircraft. The 1970s saw B-747, DC-10and L-1011 aircraft absorbed in<strong>to</strong> airline fleets. These aircraft had favourable range and unit cost characteristics andwere at <strong>the</strong> <strong>to</strong>p end of <strong>the</strong> size spectrum. In <strong>the</strong> 1980s, <strong>the</strong> airlines started <strong>to</strong> introduce mid-size aircraft such as <strong>the</strong>B-757, B-767, MD-80 and A-310. This trend continued well in<strong>to</strong> <strong>the</strong> 1990s, and <strong>the</strong> airlines witnessed <strong>the</strong>introduction of additional mid-size aircraft such as <strong>the</strong> B-777, A-330 and A-340 in<strong>to</strong> <strong>the</strong>ir fleets. Consequently, fleetreplacement and expansion led <strong>to</strong> a modest decline in <strong>the</strong> average aircraft seating capacity during <strong>the</strong> late 1990s.8. Recent trends have shown that <strong>the</strong>re has been a gradual deployment of mid-size <strong>to</strong> smaller aircraft onalmost all route groups as <strong>the</strong> need <strong>for</strong> more direct services has become a priority <strong>for</strong> travellers. Regula<strong>to</strong>rydevelopments and <strong>the</strong> characteristics of <strong>the</strong>se new aircraft types may have also been prevailing fac<strong>to</strong>rs <strong>for</strong> <strong>the</strong>irintroduction. This change has resulted in a proliferation of services aimed at cost-cutting measures by reducingflight time and <strong>the</strong> distance flown, especially on longer routes linking two regions. Route groups such as NorthAtlantic and Trans-Pacific are <strong>the</strong> prime examples where such aircraft types have increasingly been introduced.9. The regula<strong>to</strong>ry and technological fac<strong>to</strong>rs described above are likely <strong>to</strong> continue and will motivate airlines <strong>to</strong>opt <strong>for</strong> mid-size <strong>to</strong> smaller aircraft in <strong>the</strong> coming years. The number of such aircraft placed on order during <strong>the</strong> pastdecade or so also supports <strong>the</strong> continuation of this trend in<strong>to</strong> <strong>the</strong> future. During <strong>the</strong> past decade <strong>the</strong> average aircraftsize has been declining steadily and, in <strong>the</strong> year 2005, it reached its lowest level. However, progressive liberalizationand competitive <strong>for</strong>ces are encouraging consolidation and alliances among airlines which might eventually reduce<strong>the</strong> pressure <strong>to</strong> increase flight frequency at <strong>the</strong> expense of aircraft size. The build-up of airport and airspacecongestion during <strong>the</strong> <strong>for</strong>ecast horizon is ano<strong>the</strong>r fac<strong>to</strong>r which may favour larger aircraft. Based on <strong>the</strong>se fac<strong>to</strong>rs, it isassumed that over <strong>the</strong> <strong>for</strong>ecast period, <strong>the</strong> world average aircraft size will increase <strong>to</strong> about 175 seats by <strong>the</strong> year<strong>2025</strong>. Moreover, <strong>the</strong> average seat size may increase on some of <strong>the</strong> major route groups, such as Europe-Asia/Pacific,with <strong>the</strong> anticipated introduction of larger aircraft during <strong>the</strong> <strong>for</strong>ecast horizon.200100Average aircraft size(left-hand scale)Average aircraft size (seats)15010050Load fac<strong>to</strong>r(right-hand scale)755025Load fac<strong>to</strong>rs (%)001960 65 70 75 80 85 90 95 2000 2005Source: ICAO Reporting Form A.Note.— Excluding all-freight operations. Excluding <strong>the</strong> CIS.Figure 6-1. Average aircraft size and load fac<strong>to</strong>r — World (1960–2005)(Passenger aircraft on scheduled services)
Chapter 6. Forecasts of <strong>Air</strong>craft Movements <strong>to</strong> <strong>the</strong> <strong>Year</strong> <strong>2025</strong> 45MEASURES OF AIRCRAFT MOVEMENTS10. <strong>Air</strong>craft movements can be measured in terms of <strong>the</strong> number of aircraft-kilometres (or aircraft hours) flownin <strong>the</strong> airspace or <strong>the</strong> number of aircraft departures from airports. While each measure is relevant <strong>for</strong> determining <strong>the</strong>demand <strong>for</strong> air traffic control facilities, aircraft departures is <strong>the</strong> key parameter <strong>for</strong> airport planning.11. The link between <strong>the</strong> two measures is <strong>the</strong> average aircraft stage length. The trend in <strong>the</strong> average stage lengthis illustrated in Figure 6-2. In <strong>the</strong> 1960s, average stage length <strong>for</strong> scheduled services, excluding operations of airlinesregistered in <strong>the</strong> <strong>for</strong>mer USSR, increased by more than 4 per cent per annum, and thus aircraft-kilometres grewabout 4 per cent per annum faster than aircraft departures. During <strong>the</strong> 1970s, <strong>the</strong>se growth rates were much lower.Over <strong>the</strong> last decade, <strong>the</strong> aircraft-kilometres of world scheduled airlines, have grown over 4.7 per cent per annum,about 1.3 percentage points higher than departures. The growth in average stage length has been about 1.3 per centper annum during <strong>the</strong> same period. The increase in stage length reflects <strong>the</strong> changing pattern of demand, withgrowth in passenger and freight traffic being greater <strong>for</strong> long-haul routes than <strong>for</strong> short-haul routes. Ano<strong>the</strong>r fac<strong>to</strong>rhas been increases in <strong>the</strong> length-of-haul capabilities of new aircraft types progressively introduced in<strong>to</strong> fleets. Over<strong>the</strong> <strong>for</strong>ecast period (2005 <strong>to</strong> <strong>2025</strong>), <strong>the</strong> average stage length is assumed <strong>to</strong> grow at about 0.5 per cent per annum.FORECASTING METHODOLOGY12. The <strong>for</strong>ecasting process began with <strong>the</strong> <strong>for</strong>ecasts of passenger traffic and incorporated assumptions <strong>for</strong>future load fac<strong>to</strong>rs and aircraft size, which were <strong>to</strong>ge<strong>the</strong>r translated in<strong>to</strong> <strong>for</strong>ecasts of aircraft movements. Thespecification of <strong>the</strong> model used in this process is given in Appendix 2.2 400Kilometres2 0001 6001 200800International servicesAll services40001960 65 70 75 80 85 90 95 2000 2005Source: ICAO Reporting Form A.Note.— Excluding all-freight operations. Excluding <strong>the</strong> CIS.Figure 6-2. Average aircraft stage length — World (1960–2005)(Scheduled services of airlines of ICAO Contracting States)
46 <strong>Outlook</strong> <strong>for</strong> <strong>Air</strong> <strong>Transport</strong> <strong>to</strong> <strong>the</strong> <strong>Year</strong> <strong>2025</strong>13. The <strong>for</strong>ecast in terms of global aircraft-kilometres was based on passenger-kilometre <strong>for</strong>ecasts andassumptions from average passenger load fac<strong>to</strong>rs and aircraft size (measured by number of seats). Since all-freightaircraft services account <strong>for</strong> less than 5 per cent of <strong>to</strong>tal services, <strong>the</strong>ir impact on <strong>the</strong> overall trend is very small. The<strong>for</strong>ecast of global aircraft departures is derived from <strong>the</strong> <strong>for</strong>ecast of aircraft-kilometres and expectations <strong>for</strong> <strong>the</strong>future trend in average aircraft stage length. The main assumptions <strong>for</strong> growth in world scheduled passenger trafficand trends in load fac<strong>to</strong>rs, aircraft size and aircraft stage length over <strong>the</strong> period 2005–<strong>2025</strong> are given below:a) a growth in passenger-kilometres of 4.6 per cent per annum;b) an increase in average load fac<strong>to</strong>r from 75 <strong>to</strong> 80 per cent;c) an increase in average passenger aircraft size (in terms of seats) from 172 <strong>to</strong> 175 seats; andd) a growth in average aircraft stage length of 0.5 per cent per annum.FORECASTS OF WORLD SCHEDULEDAIRCRAFT MOVEMENTS14. The above analyses resulted in <strong>for</strong>ecast average world annual growth rates of 4.1 per cent <strong>for</strong>aircraft-kilometres and 3.6 per cent <strong>for</strong> aircraft departures over <strong>the</strong> period 2005 <strong>to</strong> <strong>2025</strong>.15. Over <strong>the</strong> <strong>for</strong>ecast horizon, <strong>the</strong> growth rate <strong>for</strong> aircraft-kilometres is below <strong>the</strong> growth rate <strong>for</strong>passenger-kilometres by 0.5 percentage points per annum because of <strong>the</strong> increase in load fac<strong>to</strong>r and in aircraftsize. Growth in aircraft departures is below <strong>the</strong> growth in aircraft-kilometres by 0.5 percentage point per annum,which is equal <strong>to</strong> <strong>the</strong> growth in stage length.16. In Table 6-1, <strong>the</strong> <strong>for</strong>ecasts of aircraft movements are compared with actual past movements. The rates ofgrowth reported in <strong>the</strong> table are average measures over <strong>the</strong> relevant periods; <strong>the</strong> rates over shorter periods may vary.Table 6-1. ICAO aircraft movements <strong>for</strong>ecast — World (1995–<strong>2025</strong>)(Scheduled services of airlines of ICAO Contracting States)Average annual growth rateActual Actual Forecast (per cent)1995 2005 <strong>2025</strong> 1995–2005 2005–<strong>2025</strong><strong>Air</strong>craft-kilometres (millions) 19 470 30 843 69 040 4.7 4.1<strong>Air</strong>craft departures (thousands) 17 816 24902 50 450 3.4 3.6Note.— including all-freight movements.Source: ICAO17. The <strong>for</strong>ecasts imply <strong>the</strong> doubling of aircraft-kilometres and aircraft departures between 2005 and <strong>2025</strong>. Inabsolute terms, <strong>the</strong> increase in aircraft-kilometres is expected <strong>to</strong> be some 38.2 billion, while <strong>the</strong> absolute increasein aircraft departures is <strong>for</strong>ecast <strong>to</strong> be about 25.5 million. While <strong>the</strong> interruption of traffic growth in <strong>the</strong> early
Chapter 6. Forecasts of <strong>Air</strong>craft Movements <strong>to</strong> <strong>the</strong> <strong>Year</strong> <strong>2025</strong> 472000s eased <strong>the</strong> demand pressure on aviation infrastructure <strong>to</strong> some extent (see Chapter 2, paragraph 29), overallincreases of this magnitude could result in serious congestion of certain already hard-pressed airport and airspacefacilities. It is important <strong>to</strong> recognize that in arriving at <strong>the</strong>se <strong>for</strong>ecasts, no allowance has been made <strong>for</strong> <strong>the</strong> effectthat potential supply constraints might have on traffic volumes. In o<strong>the</strong>r words, if <strong>the</strong> supply of air traffic controland airport services does not keep pace with demand in <strong>the</strong> same way that it has in <strong>the</strong> past, <strong>the</strong>n actual trafficflows may be suppressed below <strong>the</strong> levels of demand <strong>for</strong>ecast here.___________________
Appendix 1ECONOMETRIC MODELS OF DEMANDFOR WORLD SCHEDULED AIR TRAFFICThe basic model <strong>for</strong>m assumed was:y = a x 1b 1 $ x 2b 2For <strong>the</strong> model of passenger traffic:y = passenger-kilometres per<strong>for</strong>med (PKPs)x 1 =x 2 =gross domestic product in real terms (GDP)passenger revenue per passenger-kilometre in real terms (PYIELD)For <strong>the</strong> model of freight traffic:y = freight <strong>to</strong>nne-kilometres (FTKs)x 1 =x 2 =world exports in real terms (EXP)freight revenue per freight <strong>to</strong>nne-kilometre in real terms (FYIELD)The a, b 1 and b 2 are constant coefficients whose values were obtained by statistical estimation, using econometricanalysis. The b 1 and b 2 are equal <strong>to</strong> <strong>the</strong> elasticities of demand with respect <strong>to</strong> <strong>the</strong> corresponding x 1 and x 2 .Annual data were used in <strong>the</strong> estimations, covering a period of 31 years <strong>for</strong> <strong>the</strong> passenger model and 36 years <strong>for</strong> <strong>the</strong>freight model. A dummy variable was introduced in <strong>the</strong> passenger model <strong>to</strong> take in<strong>to</strong> account <strong>the</strong> special yearswhere traffic and prices (as measured by yields) grew in <strong>the</strong> same direction. The data <strong>for</strong> <strong>the</strong> CIS are excluded from<strong>the</strong> freight model. ICAO and <strong>the</strong> IMF were <strong>the</strong> sources <strong>for</strong> <strong>the</strong> airline and general economic data, respectively, usedin <strong>the</strong> models.Estimated passenger model:ln PKP = 2.31 + 1.27 ln GDP – 0.34 ln PYIELD + 0.08 Dummy R 2 = 0.995(10.6) (2.2) (3.2)Estimated freight model:ln FTK = 8.59 + 1.15 ln EXP – 0.31 ln FYIELD R 2 = 0.986(8.7) (1.9)The figures in brackets are <strong>the</strong> “t” values of <strong>the</strong> corresponding coefficient estimates. The “t” value corresponding <strong>to</strong>a particular coefficient estimate is a statistical measure of <strong>the</strong> confidence that can be normally placed in <strong>the</strong> estimate._____________________48
Appendix 2MODEL FOR AIRCRAFTMOVEMENT FORECASTS1. The relationship between aircraft-kilometres, load fac<strong>to</strong>rs and aircraft size (seats per aircraft) was developed<strong>for</strong> passenger aircraft as follows:passenger-km<strong>Air</strong>craft kilometres = (passenger-km/seat-km) i (seat-km/aircraft-km)=passenger-kmload fac<strong>to</strong>r i aircraft size(1)The <strong>for</strong>ecast <strong>for</strong> aircraft-kilometres <strong>for</strong> scheduled passenger aircraft in <strong>the</strong> year <strong>2025</strong> was generated by substitutingin<strong>to</strong> this expression <strong>the</strong> assumptions <strong>for</strong> passenger-kilometres, average load fac<strong>to</strong>r and average aircraft size in <strong>the</strong>year <strong>2025</strong>. The first of <strong>the</strong>se assumptions follows directly from <strong>the</strong> traffic <strong>for</strong>ecast presented in Chapter 5.2. The average rate of increase in aircraft-kilometres from 2005 <strong>to</strong> <strong>2025</strong> implied by this <strong>for</strong>ecast was <strong>the</strong>nused <strong>to</strong> calculate <strong>the</strong> <strong>for</strong>ecast number of aircraft-kilometres <strong>for</strong> all scheduled services, including all-freight as wellas combined passenger and freight services (but excluding <strong>the</strong> Commonwealth of Independent States).3. The relationship between aircraft departures, aircraft-kilometres and aircraft stage length <strong>for</strong> passengerand all-freight aircraft combined is derived as follows:aircraft-km<strong>Air</strong>craft departures = aircraft-km/aircraft departureaircraft-km= (2)stage lengthThe <strong>for</strong>ecast <strong>for</strong> aircraft departures in <strong>the</strong> year <strong>2025</strong> was generated by substituting in<strong>to</strong> this expression <strong>the</strong> <strong>for</strong>ecast<strong>for</strong> aircraft-kilometres and <strong>the</strong> assumption <strong>for</strong> average stage length in <strong>the</strong> year <strong>2025</strong>.4. Equations (1) and (2) can be expressed, approximately, in terms of <strong>the</strong> average annual rates of change of<strong>the</strong> variables over a specified period (e.g. 2005 <strong>to</strong> <strong>2025</strong>).Equation (1) becomes:% (ac-km) = % (passenger-km) – % (load fac<strong>to</strong>r) – % (ac size)Equation (2) becomes:% (ac departures) = % (ac-km) – % (stage length)where “ac” stands <strong>for</strong> “aircraft” and “%” stands <strong>for</strong> “average annual percentage increase”.49
50 <strong>Outlook</strong> <strong>for</strong> <strong>Air</strong> <strong>Transport</strong> <strong>to</strong> <strong>the</strong> <strong>Year</strong> 20155. The actual his<strong>to</strong>rical values and <strong>for</strong>ecast values, as well as <strong>the</strong> corresponding average annual rates ofchange <strong>for</strong> all of <strong>the</strong> variables in equations (1) and (2), are given in Table A2-1.Table A2-1. Growth in aircraft movements andcontributing fac<strong>to</strong>rs — World (1995–<strong>2025</strong>)Average annual growth rateActual Actual Forecast (per cent)1995 2005 <strong>2025</strong> 1995–2005 2005–<strong>2025</strong>Passenger-kilometres (billions) 2 248 3 720 9 140 5.2 4.6Passenger load fac<strong>to</strong>r (%) 67 75 80 1.1 0.3Passenger aircraft size (seats) 182 171 175 –0.7 0.1<strong>Air</strong>craft stage length (km) 1 093 1 239 1 368 1.3 0.5<strong>Air</strong>craft-kilometres (millions) 19 470 30 843 69 040 4.7 4.1<strong>Air</strong>craft departures (thousands) 17 816 24 902 50 450 3.4 3.6Source: ICAO.— END —
ICAO PUBLICATIONS AND RELATED PRODUCTSIN THE AIR TRANSPORT FIELDThe following summarizes <strong>the</strong> various publications and related products in <strong>the</strong> air transport field issuedby <strong>the</strong> International Civil Aviation Organization:• International Standards and Recommended Practices (SARPs) adopted by <strong>the</strong> Council inaccordance with Articles 37, 54 and 90 of <strong>the</strong> Convention on International Civil Aviation anddesignated, <strong>for</strong> convenience, as Annexes <strong>to</strong> <strong>the</strong> Convention. Annex 9 — Facilitation — containsSARPs dealing with cus<strong>to</strong>ms, quarantine, immigration and health matters concerned withinternational air navigation. Annex 17 — Security — is composed of SARPs on all matters related<strong>to</strong> safeguarding civil aviation against acts of unlawful interference. Any differences between <strong>the</strong>national regulations and practices of a State and what is prescribed by an International Standardmust be notified <strong>to</strong> <strong>the</strong> Council in accordance with Article 38 of <strong>the</strong> Convention. The Council hasalso invited Contracting States <strong>to</strong> notify differences from <strong>the</strong> provisions of <strong>the</strong> RecommendedPractices.• ICAO’s policies on <strong>the</strong> regulation of international air transport, charges <strong>for</strong> airports and airnavigation services, and taxation in <strong>the</strong> field of international air transport.• Technical specifications on machine readable travel documents (MRTDs).• Tariffs <strong>for</strong> airports and air navigation services, including charges applied <strong>to</strong>wards users in morethan 180 States.• Manuals providing in<strong>for</strong>mation or guidance <strong>to</strong> Contracting States on such issues as regulation ofinternational air transport, financial management of airports and air navigation services, air traffic<strong>for</strong>ecasting methods, and compliance with Annex 17 provisions.• Circulars providing specialized in<strong>for</strong>mation of interest <strong>to</strong> Contracting States. They include studieson medium- and long-term trends in <strong>the</strong> air transport industry at a global and regional level andspecialized studies of a worldwide nature covering issues such as <strong>the</strong> economic and financialaspects of CNS/ATM systems implementation, regional differences in airline operating economics,economic contribution of civil aviation, privatization of airports and air navigation services, andregula<strong>to</strong>ry implications of slot allocation.• Aviation Security Training Packages (ASTPs) and courses on a range of subjects designed <strong>to</strong> assistsecurity professionals, managers and staff in developing a more comprehensive understanding ofSARPs, as well as <strong>to</strong> offer specialized practical expertise in <strong>the</strong> implementation and moni<strong>to</strong>ring ofmeasures and provisions in accordance with local programmes. For fur<strong>the</strong>r in<strong>for</strong>mation, pleasecontact avsec@icao.int or visit <strong>the</strong> training page on <strong>the</strong> ICAO AVSEC website at www.icao.int/avsec.• Publications in electronic <strong>for</strong>m, in database and interactive <strong>for</strong>ms, such as <strong>the</strong> world’s air servicesagreements and <strong>the</strong> ICAO template air services agreements. Civil aviation statistics can beaccessed by purchasing an annual subscription <strong>to</strong> one or more of <strong>the</strong> data series distributed byICAO through its commercial website at www.icaodata.com. Questions regarding ICAO statisticsor special orders <strong>for</strong> statistical data should be sent <strong>to</strong> sta@icao.int.• Reports of meetings in <strong>the</strong> air transport field, including reports on <strong>the</strong> Facilitation and Statisticsdivisional-type meetings and those related <strong>to</strong> conferences on aviation security, regulation ofinternational air transport, and economics of airports and air navigation services.
©ICAO20079/07, E/P1/1200Order No. CIR313PrintedinICAO