Outlook for Air Transport to the Year 2015 - FILT CGIL Foggia
Outlook for Air Transport to the Year 2015 - FILT CGIL Foggia
Outlook for Air Transport to the Year 2015 - FILT CGIL Foggia

Create successful ePaper yourself
Turn your PDF publications into a flip-book with our unique Google optimized e-Paper software.
FOREWORDIntroduction1. This circular contains in<strong>for</strong>mation on air transport trends and challenges and long-term airline passengerand freight traffic <strong>for</strong>ecasts, in <strong>to</strong>tal and by region of registration, <strong>for</strong> <strong>the</strong> period through <strong>to</strong> <strong>the</strong> year <strong>2015</strong>.In addition, it includes passenger traffic <strong>for</strong>ecasts <strong>for</strong> international route groups and global <strong>for</strong>ecasts of aircraftmovements, again through <strong>to</strong> <strong>the</strong> year <strong>2015</strong>. The present circular is <strong>the</strong> fifth in a series <strong>to</strong> be issued bienniallyor triennially (<strong>the</strong> previous edition “<strong>Outlook</strong> <strong>for</strong> <strong>Air</strong> <strong>Transport</strong> <strong>to</strong> <strong>the</strong> <strong>Year</strong> 2010” was published in 2001 asCircular 281).Sources of in<strong>for</strong>mation2. In addition <strong>to</strong> <strong>the</strong> ICAO Digests of Statistics, use has been made of many of <strong>the</strong> Organization’s economicstudies and of <strong>the</strong> Annual Reports of <strong>the</strong> Council <strong>to</strong> <strong>the</strong> Assembly <strong>for</strong> <strong>the</strong> years 1992 <strong>to</strong> 2002. Sources ofin<strong>for</strong>mation o<strong>the</strong>r than ICAO, referred <strong>to</strong> in <strong>the</strong> circular, include <strong>the</strong> appropriate and most recently availablestatistical publications of <strong>the</strong> United Nations, <strong>the</strong> United Nations Conference on Trade and Development(UNCTAD), <strong>the</strong> European Civil Aviation Conference (ECAC), <strong>the</strong> Organization <strong>for</strong> Economic Co-operation andDevelopment (OECD), <strong>the</strong> International <strong>Air</strong> <strong>Transport</strong> Association (IATA), <strong>the</strong> Association of European <strong>Air</strong>lines(AEA), <strong>the</strong> United States Department of <strong>Transport</strong>ation (DOT) and Department of Energy (DOE), <strong>the</strong> WorldTourism Organization (WTO-OMT), <strong>the</strong> International Monetary Fund (IMF), <strong>the</strong> World Bank, BACK AviationAssociates, <strong>the</strong> WEFA Group (<strong>for</strong>merly known as Whar<strong>to</strong>n Econometrics Forecasting Associates) and aerospacemanufacturers.3. Unless indicated o<strong>the</strong>rwise, all references in this circular <strong>to</strong> “cents” mean U.S. cents, and all references <strong>to</strong>“dollars” mean U.S. dollars; references <strong>to</strong> “billion” mean one thousand million.Status4. This circular has been approved by <strong>the</strong> Secretary General and is published under his authority.___________________(i)
(iv) <strong>Outlook</strong> <strong>for</strong> <strong>Air</strong> <strong>Transport</strong> <strong>to</strong> <strong>the</strong> <strong>Year</strong> <strong>2015</strong>Chapter 6. Forecasts of <strong>Air</strong>craft Movements <strong>to</strong> <strong>the</strong> <strong>Year</strong> <strong>2015</strong>. . . . . . . . . . . . . . . . . . . . . . . . . . . . 42Fac<strong>to</strong>rs affecting aircraft movements . . . . . . . . . . . . . . . . . . . . . . . . . . . . . . . . . . . . . . . . . . . . . . 42Measures of aircraft movements. . . . . . . . . . . . . . . . . . . . . . . . . . . . . . . . . . . . . . . . . . . . . . . . . . 44Forecasting methodology. . . . . . . . . . . . . . . . . . . . . . . . . . . . . . . . . . . . . . . . . . . . . . . . . . . . . . . 44Forecasts of world scheduled aircraft movements . . . . . . . . . . . . . . . . . . . . . . . . . . . . . . . . . . . . . 45PageAPPENDICESAppendix 1. Econometric Models of Demand <strong>for</strong> World Scheduled <strong>Air</strong> Traffic . . . . . . . . . . . . . . 47Appendix 2. Model <strong>for</strong> <strong>Air</strong>craft Movement Forecasts . . . . . . . . . . . . . . . . . . . . . . . . . . . . . . . . . . 49TABLESTable 1-1. ICAO air traffic <strong>for</strong>ecasts — World (1992–<strong>2015</strong>) . . . . . . . . . . . . . . . . . . . . . . . . . . . . . . 2Table 1-2. ICAO air traffic <strong>for</strong>ecasts — Regions of airline registration (1992–<strong>2015</strong>) . . . . . . . . . . . . . 3Table 1-3. ICAO air traffic <strong>for</strong>ecasts — Intercontinental route groups (1992–<strong>2015</strong>). . . . . . . . . . . . . . 4Table 2-1. Trends in <strong>to</strong>tal scheduled traffic — World (1960–2002). . . . . . . . . . . . . . . . . . . . . . . . . . 6Table 2-2. International non-scheduled passenger traffic — World (1992 and 2002) . . . . . . . . . . . . . 10Table 2-3. Productivity of international scheduled airlines — World (1965–2002). . . . . . . . . . . . . . . 12Table 4-1. Operating revenues and expenses — World (1970–2002). . . . . . . . . . . . . . . . . . . . . . . . . 25Table 4-2. Total and unit operating revenues and expenses — World (1992 and 2002) . . . . . . . . . . . 26Table 4-3. Distribution of operating revenues and expenses — World (1992 and 2002) . . . . . . . . . . . 31Table 4-4.Distribution of operating revenues and expenses — Regions ofairline registration (1992 and 2002) . . . . . . . . . . . . . . . . . . . . . . . . . . . . . . . . . . . . . . . 32Table 5-1. ICAO scheduled passenger traffic <strong>for</strong>ecasts — World (1992–<strong>2015</strong>) . . . . . . . . . . . . . . . . . 35Table 5-2. ICAO scheduled passenger traffic — Regions of airline registration (1992–<strong>2015</strong>). . . . . . . 37Table 5-3. ICAO scheduled passenger traffic — Intercontinental route groups (1992–<strong>2015</strong>) . . . . . . . 38Table 5-4. ICAO scheduled freight traffic <strong>for</strong>ecasts — World (1992–<strong>2015</strong>) . . . . . . . . . . . . . . . . . . . 39Table 5-5. ICAO scheduled freight traffic — Regions of airline registration (1992–<strong>2015</strong>) . . . . . . . . . 40Table 5-6. Global scheduled traffic <strong>for</strong>ecasts by aerospace manufacturers . . . . . . . . . . . . . . . . . . . . 41Table 6-1. ICAO aircraft movements <strong>for</strong>ecast — World (1982–<strong>2015</strong>) . . . . . . . . . . . . . . . . . . . . . . . 46Table A2-1. Growth in aircraft movements and contributing fac<strong>to</strong>rs — World (1982–<strong>2015</strong>) . . . . . . . . . 50FIGURESFigure 2-1. Economic and airline traffic trends — World (1960–2002). . . . . . . . . . . . . . . . . . . . . . . . 6Figure 2-2. Trends in scheduled international and domestic traffic — World (1992 and 2002). . . . . . . 7Figure 2-3. International passenger and freight traffic — Shares by region (1992 and 2002) . . . . . . . . 8Figure 2-4. Passengers on scheduled services — Intercontinental route groups (1992 and 2002) . . . . . 9Figure 2-5. Growth in passengers and aircraft movements — World (1960–2002) . . . . . . . . . . . . . . . 10Figure 2-6. Composition of commercial aircraft fleet — World (1960–2002) . . . . . . . . . . . . . . . . . . . 11Figure 2-7. Trends in airline productivity — World (1960–2002). . . . . . . . . . . . . . . . . . . . . . . . . . . . 13Figure 2-8. Input price trends — World (1960–2002) . . . . . . . . . . . . . . . . . . . . . . . . . . . . . . . . . . . . 14Figure 2-9. Trends in airline industry per<strong>for</strong>mance — World (1960–2002) . . . . . . . . . . . . . . . . . . . . . 14Figure 3-1. Growth of real GDP and GDP per capita — World (1992–2005) . . . . . . . . . . . . . . . . . . . 23Figure 4-1. Scheduled airline operating revenues and expenses — World (1992–2002). . . . . . . . . . . . 26Figure 4-2. Financial per<strong>for</strong>mance indica<strong>to</strong>rs of scheduled airlines — World (1992–2002) . . . . . . . . . 27
Table of Contents(v)Figure 4-3. Passenger and freight yields of scheduled airlines — World (1960–2002). . . . . . . . . . . . . 29Figure 4-4. Unit operating costs of scheduled airlines — World (1992–2002). . . . . . . . . . . . . . . . . . . 29Figure 4-5. Share of fuel and oil in operating expenses of scheduled airlines — World (1992–2002) . . 30Figure 5-1. Trends in scheduled passenger traffic — World (1992–<strong>2015</strong>). . . . . . . . . . . . . . . . . . . . . . 35Figure 5-2. Trends in scheduled freight traffic — World (1992–<strong>2015</strong>) . . . . . . . . . . . . . . . . . . . . . . . . 39Figure 6-1. Average aircraft size and load fac<strong>to</strong>r — World (1960–2002) . . . . . . . . . . . . . . . . . . . . . . 43Figure 6-2. Average aircraft stage length — World (1960–2002) . . . . . . . . . . . . . . . . . . . . . . . . . . . . 45Page___________________
Chapter 1SUMMARY1. During <strong>the</strong> period 1960–2002, <strong>the</strong> aggregate economic activities of <strong>the</strong> world measured by GrossDomestic Product (GDP) increased at an average annual rate of 3.4 per cent in real terms. For <strong>the</strong> period 1992–2002, GDP and GDP per capita grew at an average annual rate of 3.0 per cent and 1.6 per cent, respectively (seeChapter 3).2. Growth in air transport has been much greater than economic growth but is closely linked with it. Worldairline scheduled passenger traffic (domestic and international) measured in terms of passenger-kilometresper<strong>for</strong>med (PKPs) increased at an average annual rate of 8.1 per cent <strong>for</strong> <strong>the</strong> 1960–2002 period. For <strong>the</strong> periods1960–1972, 1972–1982, 1982–1992 and 1992–2002, passenger traffic grew at an average annual rate of 12.8, 7.6,5.4 and 4.3 per cent, respectively (see Table 2-1). While economic conditions continued <strong>to</strong> be <strong>the</strong> major driver ofair travel demand, security and safety concerns and so-called fear and hassle fac<strong>to</strong>rs, triggered by <strong>the</strong>unprecedented events of 11 September 2001, had adverse effects on air traffic in 2001 and 2002. These effects,fur<strong>the</strong>r amplified by <strong>the</strong> war in Iraq and <strong>the</strong> outbreak of Severe Acute Respira<strong>to</strong>ry Syndrome (SARS), continuedin 2003 and were taken in<strong>to</strong> account <strong>for</strong> <strong>the</strong> projection of future air traffic trends.3. World airline scheduled freight traffic (domestic and international) measured in terms of<strong>to</strong>nne-kilometres per<strong>for</strong>med (TKPs) increased at an average annual rate of 8.5 per cent over <strong>the</strong> 1960–2002 period.For <strong>the</strong> periods 1960–1972, 1972–1982, 1982–1992 and 1992–2002, freight traffic grew at an average annual rateof 16.9, 8.2, 7.1 and 6.4 per cent, respectively (see Table 2-1).4. The growth in passenger and freight traffic demand over <strong>the</strong> 1960–2002 period resulted in comparablegrowth in capacity offered, while aircraft movements measured in terms of aircraft departures grew at a muchslower rate (2.7 per cent per annum) due primarily <strong>to</strong> a large increase in average aircraft size and in averagedistance flown per aircraft departure during this period. His<strong>to</strong>rical traffic trends are described in Chapter 2.5. During <strong>the</strong> period 1960–2002, average world passenger yield measured in real terms (expressed in U.S.cents per PKP) declined at a rate of 2.5 per cent per annum. Freight and mail yield measured in real terms(expressed in U.S. cents per TKP) decreased at a rate of 3.5 per cent per annum. During <strong>the</strong> same period, unitcosts (operating cost per available <strong>to</strong>nne-kilometre (ATK)) measured in real terms declined at an average annualrate of 2.5 per cent (see Chapter 4).6. Future growth of air transport will continue <strong>to</strong> depend primarily on world economic and trade growth andairline cost developments (which are in turn heavily dependent on fuel prices). This growth will also beinfluenced, however, by <strong>the</strong> extent <strong>to</strong> which <strong>the</strong> industry faces up <strong>to</strong> major challenges such as fear and hasslefac<strong>to</strong>rs influencing consumer confidence, airport and airspace congestion, environmental protection andincreasing capital investment needs. The shape and size of <strong>the</strong> air transport system will also be affected bygovernmental decisions, notably those determining <strong>the</strong> type and extent of economic regulation of airlines. <strong>Air</strong>linetraffic <strong>for</strong>ecasts are presented in Chapter 5.7. For <strong>the</strong> <strong>for</strong>ecast period 2002–<strong>2015</strong>, world economic growth (GDP) is expected <strong>to</strong> increase at an averageannual rate of 2.5 per cent in real terms. <strong>Air</strong>line yields are expected <strong>to</strong> decline at an annual rate of 0.5 per cent <strong>for</strong><strong>the</strong> first four years <strong>for</strong> passenger traffic and six years <strong>for</strong> freight traffic and <strong>to</strong> stabilize <strong>for</strong> <strong>the</strong> remaining years of<strong>the</strong> <strong>for</strong>ecast horizon.1
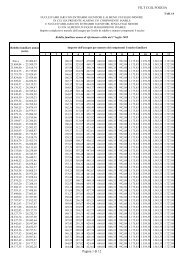
2 <strong>Outlook</strong> <strong>for</strong> <strong>Air</strong> <strong>Transport</strong> <strong>to</strong> <strong>the</strong> <strong>Year</strong> <strong>2015</strong>8. World scheduled traffic measured in terms of passenger-kilometres per<strong>for</strong>med is <strong>for</strong>ecast <strong>to</strong> increase at a“most likely” average annual rate of 4.4 per cent <strong>for</strong> <strong>the</strong> period 2002–<strong>2015</strong>. International traffic is expected <strong>to</strong>increase at 5.1 per cent per annum, while domestic traffic is expected <strong>to</strong> increase at an average annual rate of 3.1per cent.9. The airlines of <strong>the</strong> Middle East region are expected <strong>to</strong> experience <strong>the</strong> highest growth in passenger trafficat 6.4 per cent per annum through <strong>to</strong> <strong>the</strong> year <strong>2015</strong>, followed by <strong>the</strong> airlines of <strong>the</strong> Asia/Pacific region with a6.1 per cent annual growth rate. <strong>Air</strong>line traffic in each of <strong>the</strong> European, Latin America/Caribbean and Africanregions is expected <strong>to</strong> grow at around 4 per cent, slightly below <strong>the</strong> world average. In <strong>the</strong> North American region,airline traffic is expected <strong>to</strong> increase at 2.8 per cent per annum.10. Forecasts of <strong>the</strong> number of passengers carried on scheduled services in nine intercontinental route groupsshow <strong>the</strong> Transpacific and <strong>the</strong> Europe-Africa markets as <strong>the</strong> fastest growing, at 6.6 per cent and 5.5 per cent perannum, respectively, <strong>for</strong> <strong>the</strong> <strong>for</strong>ecast period through <strong>to</strong> <strong>2015</strong>.11. World scheduled freight traffic measured in terms of <strong>to</strong>nne-kilometres per<strong>for</strong>med is <strong>for</strong>ecast <strong>to</strong> increase ata “most likely” average annual rate of 5.5 per cent <strong>for</strong> <strong>the</strong> period 2002–<strong>2015</strong>. International freight traffic isexpected <strong>to</strong> increase at an average annual growth rate of 5.8 per cent compared with a domestic freight trafficgrowth of 3.2 per cent per annum. <strong>Air</strong> freight traffic in <strong>the</strong> Middle East region is expected <strong>to</strong> remain <strong>the</strong> fastestgrowing at 6.6 per cent per annum, followed by <strong>the</strong> Asia/Pacific region (6.4 per cent). O<strong>the</strong>r regions are projected<strong>to</strong> experience growth rates below <strong>the</strong> world average, ranging from around 5 per cent <strong>for</strong> <strong>the</strong> North American andEuropean regions <strong>to</strong> 2.5 per cent <strong>for</strong> <strong>the</strong> Latin America/Caribbean region.12. <strong>Air</strong>craft movements in terms of aircraft departures and aircraft kilometres flown <strong>for</strong> <strong>the</strong> period 2002–<strong>2015</strong> are expected <strong>to</strong> increase at average annual rates of 3.2 and 4.2 per cent, respectively (see Chapter 6).13. Tables 1-1, 1-2 and 1-3 provide summaries of traffic <strong>for</strong>ecasts at <strong>the</strong> global, regional and intercontinentalroute group level.Table 1-1. ICAO air traffic <strong>for</strong>ecasts World (1992–<strong>2015</strong>)(ICAO Contracting States)Average annual growthrate (per cent)Actual Actual ForecastScheduled services 1992 2002 <strong>2015</strong> 1992–2002 2002–<strong>2015</strong>TOTALPassenger-kilometres (billions) 1 928 2 942 5 120 4.3 4.4Freight <strong>to</strong>nne-kilometres (millions) 62 675 116 628 233 850 6.4 5.5Passengers carried (millions) 1 146 1 615 2 520 3.5 3.5Freight <strong>to</strong>nnes carried (thousands) 17 647 29 538 51 700 5.3 4.4<strong>Air</strong>craft-kilometres (millions) 1 15 420 23 878 40 750 4.5 4.2<strong>Air</strong>craft departures (thousands) 1 14 728 20 013 30 010 3.1 3.2INTERNATIONALPassenger-kilometres (billions) 982 1 732 3 310 5.8 5.1Freight <strong>to</strong>nne-kilometres (millions) 50 753 100 588 209 600 7.1 5.8Passengers carried (millions) 299 544 1 030 6.2 5.0Freight <strong>to</strong>nnes carried (thousands) 9 313 19 013 37 200 7.4 5.31. Excluding operations of airlines registered in <strong>the</strong> Commonwealth of Independent States (CIS).Source: ICAO
Chapter 1. Summary 3Table 1-2. ICAO air traffic <strong>for</strong>ecasts Regions of airline registration (1992–<strong>2015</strong>)(ICAO Contracting States)Average annual growthrate (per cent)Scheduled services by region Actual Actual Forecas<strong>to</strong>f airline registration 1992 2002 <strong>2015</strong> 1992–2002 2002–<strong>2015</strong>TOTALPassenger-kilometres (billions)Africa 42.9 66.2 110 4.4 4.0Asia/Pacific 409.2 785.1 1 700 6.7 6.1Europe 525.7 769.7 1 300 3.9 4.1Middle East 53.4 106.7 240 7.2 6.4North America 806.4 1 082.3 1 550 3.0 2.8Latin America and Caribbean 90.9 132.3 220 3.8 4.0Freight <strong>to</strong>nne-kilometres (millions)Africa 1 238 1 856 3 100 4.1 4.0Asia/Pacific 19 410 42 062 94 600 8.0 6.4Europe 19 460 32 828 61 000 5.4 4.9Middle East 2 625 5 355 12 250 7.4 6.6North America 16 867 30 586 57 500 6.1 5.0Latin America and Caribbean 3 075 3 940 5 400 2.5 2.5INTERNATIONALPassenger-kilometres (billions)Africa 34.9 57.5 100 5.1 4.3Asia/Pacific 276.8 537.6 1 220 6.9 6.5Europe 330.8 643.8 1 150 6.9 4.6Middle East 44.5 93.5 220 7.7 6.8North America 238.8 322.4 490 3.0 3.3Latin America and Caribbean 56.4 77.4 130 3.2 3.9Freight <strong>to</strong>nne-kilometres (millions)Africa 1 135 1 777 3 000 4.6 4.1Asia/Pacific 17 752 38 196 86 500 8.0 6.5Europe 17 680 32 019 60 000 6.1 4.9Middle East 2 552 5 251 12 100 7.5 6.6North America 9 114 20 264 44 000 8.3 6.1Latin America and Caribbean 2 520 3 079 4 000 2.0 2.0Source: ICAO
4 <strong>Outlook</strong> <strong>for</strong> <strong>Air</strong> <strong>Transport</strong> <strong>to</strong> <strong>the</strong> <strong>Year</strong> <strong>2015</strong>Table 1-3. ICAO air traffic <strong>for</strong>ecasts Intercontinental route groups (1992–<strong>2015</strong>)(ICAO Contracting States)International scheduled servicesActual1992Passengers carried (thousands)Actual2002Average annual growthrate (per cent)Forecast<strong>2015</strong> 1992–2002 2002–<strong>2015</strong>North Atlantic 40 900 64 900 123 600 4.7 5.1Mid-Atlantic 2 300 3 900 7 300 5.4 4.9South Atlantic 2 760 4 370 7 750 4.7 4.5Trans-Pacific 18 121 24 279 55 916 3.0 6.6Between Europe and Asia/Pacific 15 000 30 000 57 300 7.2 5.1Between Europe and Africa 13 200 21 645 43 410 5.1 5.5Between Europe and Middle East 8 100 13 100 24 700 4.9 5.0Between North America and South 5 250 8 740 15 500 5.2 4.5AmericaBetween North America and CentralAmerica/Caribbean22 000 35 800 65 000 5.0 4.7Total above routes 127 631 206 734 400 476 4.9 5.2O<strong>the</strong>r routes 171 836 337 876 629 524 7.0 4.9Total world 299 467 544 610 1 030 000 6.2 5.0Source: ICAO___________________
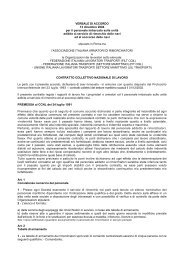
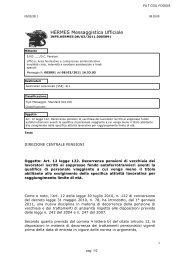
Chapter 2AIR TRANSPORT TRENDS AND CHALLENGESECONOMIC DEVELOPMENT AND AIRLINE TRAFFIC PATTERNS1. From a long-term his<strong>to</strong>rical perspective, air transport has experienced greater growth than most o<strong>the</strong>rindustries. Since 1960, increasing demand <strong>for</strong> passenger and freight services, rapid technological developmentand associated investment have combined <strong>to</strong> multiply <strong>the</strong> output of <strong>the</strong> air transport industry by a fac<strong>to</strong>r of nearly30 in terms of TKPs. This expansion of air transport compares favourably with <strong>the</strong> broadest available measure ofworld output, <strong>the</strong> global GDP, which when measured in real terms has multiplied by 4 times over <strong>the</strong> same period.2. Economic <strong>the</strong>ory and analytical studies indicate that <strong>the</strong>re is a high correlation between <strong>the</strong> growthpatterns of air traffic and economic trends in that <strong>the</strong> demand <strong>for</strong> air transport is primarily driven by economicdevelopment. Developments in personal income affect <strong>the</strong> level of consumer purchasing power and <strong>the</strong>propensity <strong>to</strong> undertake leisure travel. Commercial activity and trade have a direct impact on <strong>the</strong> demand <strong>for</strong>business travel and <strong>for</strong> air freight. Figure 2-1 provides evidence of <strong>the</strong> relationship between <strong>the</strong> strength of <strong>the</strong>economy and traffic demand by illustrating <strong>the</strong> fluctuations in <strong>the</strong> rate of growth of each <strong>for</strong> <strong>the</strong> period 1960 <strong>to</strong><strong>the</strong> present. The impact of economic slowdowns and recessions on air traffic trends is clearly visible during <strong>the</strong>following years or periods: 1974–75, 1980–82, 1990–91, 1998 and 2001 (<strong>the</strong> latter coupled with <strong>the</strong>unprecedented events of 11 September).3. Between 1992 and 2002, worldwide scheduled traffic, measured in TKPs, grew at an average annual rateof 4.9 per cent, compared <strong>to</strong> a 3.0 per cent GDP growth. While <strong>the</strong> pattern of traffic growth over that period wasgenerally a reflection of economic conditions, <strong>the</strong> impact of recent event-related developments on air traveldemand (events of 11 September 2001, war in Iraq and <strong>the</strong> SARS outbreak) indicate that <strong>the</strong> air transport industryis sensitive <strong>to</strong> safety and security concerns and so-called fear and hassle fac<strong>to</strong>rs which influence consumerconfidence.4. O<strong>the</strong>r fac<strong>to</strong>rs that have affected traffic demand include airline costs, and hence fares and rates, regula<strong>to</strong>rydevelopments and <strong>the</strong> access <strong>to</strong> air and <strong>to</strong>urism services. Rapid growth in <strong>the</strong> 1960s coincided with <strong>the</strong>replacement of pis<strong>to</strong>n-engine aircraft with jet aircraft which led <strong>to</strong> reduced real fares and increased speed andcom<strong>for</strong>t of travel. In addition <strong>to</strong> an adverse effect on <strong>the</strong> world economy, sharp changes in <strong>the</strong> price of oil andaviation fuel (such as in 1973–1974 and fur<strong>the</strong>r escalation during 1979–1981) have had important effects onairline costs.TRENDS IN SCHEDULED PASSENGER, FREIGHT AND MAIL TRAFFIC5. Over <strong>the</strong> decades, <strong>the</strong> growth experienced by <strong>the</strong> <strong>to</strong>tal demand <strong>for</strong> air transport has been shared <strong>to</strong> avarying extent by each of its major components — passenger, freight and mail traffic. The average growth rate <strong>for</strong>each of <strong>the</strong>se components has declined since <strong>the</strong> 1960s as shown in Table 2-1. The gradual decline in mail traffichas been particularly severe, partly because of increasing competition from telecommunications.5
6 <strong>Outlook</strong> <strong>for</strong> <strong>Air</strong> <strong>Transport</strong> <strong>to</strong> <strong>the</strong> <strong>Year</strong> <strong>2015</strong>Table 2-1. Trends in <strong>to</strong>tal scheduled traffic World (1960–2002)(ICAO Contracting States)Average annual growth (per cent)Scheduled services 1960–1972 1972–1982 1982–1992 1992–2002Passenger-kilometres 12.8 7.6 5.4 4.3Freight <strong>to</strong>nne-kilometres 16.9 8.2 7.1 6.4Mail <strong>to</strong>nne-kilometres 12.2 3.2 2.8 –1.2Total <strong>to</strong>nne-kilometres 13.7 7.6 5.7 4.9Note: Excluding operations of airlines registered in <strong>the</strong> CIS.Source: ICAO Reporting Form A-1.<strong>2015</strong>TKPAnnual change (%)105Real GDP0-51960 63 66 69 72 75 78 81 84 87 90 93 96 99 2002Source: IMF, WEFA, ICAO Reporting Form A-1.Figure 2-1. Economic and airline traffic trends — World (1960–2002)(GDP in real terms and <strong>to</strong>tal scheduled TKPs)
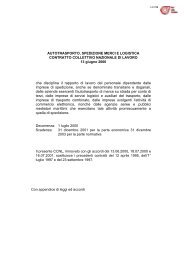
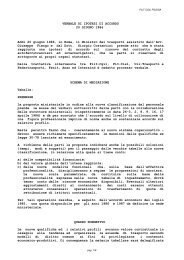
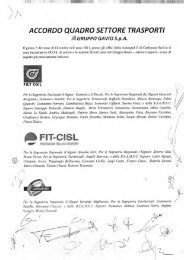
Chapter 2. <strong>Air</strong> <strong>Transport</strong> Trends and Challenges 76. In 2002, <strong>the</strong> world’s airlines carried over 1.6 billion passengers and 30 million <strong>to</strong>nnes of freight and mailon scheduled services. <strong>Air</strong>lines per<strong>for</strong>med on scheduled services 2 942 billion passenger-kilometres (equivalent <strong>to</strong>271 billion <strong>to</strong>nne-kilometres), 116 billion freight <strong>to</strong>nne-kilometres (FTKs) and 4.5 billion mail <strong>to</strong>nne-kilometresin 2002. From 1992–2002 <strong>to</strong>tal scheduled traffic grew at an average annual rate of 4.9 per cent.International and domestic traffic7. International traffic has tended <strong>to</strong> grow more rapidly than domestic traffic, particularly in <strong>the</strong> case offreight. Figure 2-2 shows <strong>the</strong> expansion in <strong>the</strong> international and domestic components of scheduled passenger andfreight traffic over <strong>the</strong> period 1992 <strong>to</strong> 2002. Over this 10-year period both passenger and freight traffic almostdoubled on international routes namely from 982 billion PKPs in 1992 <strong>to</strong> 1 732 billion PKPs in 2002 and from50 754 million FTKs <strong>to</strong> 100 588 million FTKs, respectively.Regional distribution of scheduled international traffic8. Figure 2-3 compares <strong>the</strong> share of international passenger and freight traffic by region of airlineregistration in 1992 and 2002. <strong>Air</strong>lines registered in Europe retained <strong>the</strong> major share in passenger traffic, i.e.about 34.0 and 37.0 per cent in 1992 and 2002, respectively. <strong>Air</strong>lines registered in <strong>the</strong> Asia/Pacific region rankedsecond and increased <strong>the</strong>ir share of international passenger traffic <strong>to</strong> 31.0 per cent. North American airlines kept<strong>the</strong> third rank but with a decreased share of around 19 per cent. Among <strong>the</strong> airlines from <strong>the</strong> regions with smallershares, Middle Eastern carriers increased <strong>the</strong>ir share while <strong>the</strong> remaining regions saw <strong>the</strong>ir shares decrease.9. <strong>Air</strong>lines of <strong>the</strong> Asia/Pacific region retained <strong>the</strong>ir major share of freight traffic and increased it from35.0 per cent <strong>to</strong> 38.0 per cent, while <strong>the</strong> European airlines decreased <strong>the</strong>ir share by 3 percentage points <strong>to</strong>31.8 per cent in 2002. The North American region increased its share <strong>to</strong> 20.1 per cent in 2002. The o<strong>the</strong>r regionswith significantly lower freight traffic experienced smaller changes in <strong>the</strong>ir respective shares.Passenger traffic on major intercontinental route groups10. Figure 2-4 illustrates trends of scheduled passenger traffic on major intercontinental route groupsbetween 1992 and 2002 (<strong>for</strong> data see Table 1-3). It clearly displays <strong>the</strong> strength of <strong>the</strong> North Atlantic market, in2 000Passenger-kilometres per<strong>for</strong>med1 7321992 2002120 000100 000Freight <strong>to</strong>nne-kilometres100 5901992 2002Billions1 5001 000982 9471 210Millions80 00060 00050 75040 00050020 00016 04011 8900InternationalDomestic0InternationalDomesticSource: ICAO Reporting Form A-1.Figure 2-2. Trends in scheduled international anddomestic traffic — World (1992 and 2002)
8 <strong>Outlook</strong> <strong>for</strong> <strong>Air</strong> <strong>Transport</strong> <strong>to</strong> <strong>the</strong> <strong>Year</strong> <strong>2015</strong>1992Passenger-kilometres per<strong>for</strong>med200228.231.033.73.63.35.737.24.54.5 24.35.418.6199235.0Freight <strong>to</strong>nne-kilometres200238.034.82.25.031.81.83.15.018.05.220.1Africa Asia/Pacific EuropeMiddle East North America Latin America/CaribbeanSource: ICAO Reporting Form A-1.Figure 2-3. International passenger andfreight traffic — Shares by region (1992 and 2002)terms of its size (more than 64 million passengers in 2002) and growth (some 60 per cent increase of traffic at anaverage annual growth rate of 4.7 per cent). Over <strong>the</strong> same period, <strong>the</strong> faster growing route groups among <strong>the</strong>o<strong>the</strong>r four large markets (with a passenger volume of over 20 million in 2002) were Europe-Asia/Pacific,Europe-Africa and North America-Central America/Caribbean with average annual growth of 7.2, 5.1 and 5.0 percent, respectively.TRENDS IN NON-SCHEDULED PASSENGER TRAFFIC11. The global development of non-scheduled traffic has been partially masked by some statistical reportingdeficiencies among non-scheduled air carriers. Available data, however, permit some indications of <strong>the</strong>development and importance of charter traffic.
Chapter 2. <strong>Air</strong> <strong>Transport</strong> Trends and Challenges 970601992 2002Passengers carried (millions)50403020100North AtlanticMid-AtlanticSouth AtlanticTranspacificEurope-Asia/PacificSource: IATA, ICAO Reporting Form B and manufacturers.Europe-AfricaEurope-Middle EastNorth America-South AmericaNorth America-Central America/CaribbeanFigure 2-4. Passengers on scheduled services — Intercontinentalroute groups (1992 and 2002)12. Non-scheduled air transport is primarily devoted <strong>to</strong> international passenger traffic, with freight traffic anddomestic traffic being relatively small by comparison. Non-scheduled passenger traffic represented about 14 <strong>to</strong>15 per cent of <strong>the</strong> <strong>to</strong>tal international passenger traffic during <strong>the</strong> latter part of <strong>the</strong> 1990s. Table 2-2 providesestimates <strong>for</strong> 1992 and 2002 of non-scheduled passenger traffic carried by non-scheduled and scheduled carriers.Growth in <strong>the</strong>ir combined non-scheduled international traffic was approximately 3.6 per cent per annum onaverage in terms of PKPs during <strong>the</strong> 1992–2002 period, below <strong>the</strong> 5.8 per cent per annum growth rate <strong>for</strong>scheduled international traffic. Non-scheduled traffic is very important on intra-European routes which account<strong>for</strong> <strong>the</strong> largest part of <strong>the</strong> world charter market in terms of passengers, followed by North Atlantic routes.AIRCRAFT MOVEMENTS13. The growing demand <strong>for</strong> passenger and freight air services since 1960 went hand in hand with anexpanded fleet capacity. Growth patterns of passenger numbers, aircraft departures and aircraft-kilometres areportrayed in Figure 2-5. A statistical smoothing technique has been used <strong>to</strong> eliminate large, short-termfluctuations in order <strong>to</strong> better illustrate <strong>the</strong> trends in <strong>the</strong> relationships between <strong>the</strong> variables.
10 <strong>Outlook</strong> <strong>for</strong> <strong>Air</strong> <strong>Transport</strong> <strong>to</strong> <strong>the</strong> <strong>Year</strong> <strong>2015</strong>Table 2-2.International non-scheduled passenger traffic World (1992 and 2002)(ICAO Contracting States)Passenger-kilometresper<strong>for</strong>med1992 2002(billions) (billions)Averageannualgrowth(per cent)Non-scheduled carriers 93.2 95.5 0.2Scheduled carriers 78.5 149.1 6.6Total 171.7 244.6 3.6Source: ICAO Reporting Form A-2.Figure 2-5. Growth in passengers and aircraft movements — World (1960–2002)(Total scheduled operations)
Chapter 2. <strong>Air</strong> <strong>Transport</strong> Trends and Challenges 1114. The large gap between <strong>the</strong> growth rates <strong>for</strong> passengers carried and aircraft departures that existed in <strong>the</strong>1960s and 1970s is primarily a reflection of <strong>the</strong> increases in average aircraft size over this period. In <strong>the</strong> 1980s, asthis trend in aircraft size levelled out, <strong>the</strong> growth rate <strong>for</strong> aircraft departures increased <strong>to</strong>wards <strong>the</strong> passengergrowth rate.15. The growth in aircraft-kilometres has been consistently higher than <strong>the</strong> growth in aircraft departures, witha particularly large gap in <strong>the</strong> 1960s and early 1970s, since <strong>the</strong> average aircraft stage length (i.e. average length ofnon-s<strong>to</strong>p flights) has been increasing. The rate of increase in average stage length was greatest when jet aircraftwere replacing pis<strong>to</strong>n-engine aircraft.FLEET COMPOSITION AND PRODUCTIVITY16. At <strong>the</strong> end of 2002, <strong>the</strong> scheduled and non-scheduled carriers of ICAO Contracting States had acombined fleet of about 20 877 aircraft of over 9 <strong>to</strong>nnes (t) maximum take-off mass (MTOM) <strong>for</strong> <strong>the</strong>irinternational and domestic operations. This is an increase of about 40 per cent over <strong>the</strong> 1992 fleet. The number ofjet aircraft at <strong>the</strong> end of 2002 was some 16 670, which is an increase of about 39 per cent over 1992. Jet aircraf<strong>to</strong>bviously account <strong>for</strong> an even larger proportion of carriers’ fleet capacity than indicated by <strong>the</strong> relative number ofaircraft. Figure 2-6 contrasts <strong>the</strong> steep upward trend in <strong>the</strong> number of jet aircraft since 1960 with <strong>the</strong> slow growthin <strong>the</strong> number of turboprop aircraft and <strong>the</strong> decline in pis<strong>to</strong>n-engine aircraft.Figure 2-6. Composition of commercial aircraft fleet — World (1960–2002)(aircraft of 9 t MTOM and over)
12 <strong>Outlook</strong> <strong>for</strong> <strong>Air</strong> <strong>Transport</strong> <strong>to</strong> <strong>the</strong> <strong>Year</strong> <strong>2015</strong>17. The progressive absorption of advanced aerospace technology in<strong>to</strong> airline fleets has been a major sourceof productivity improvement <strong>for</strong> <strong>the</strong> airline industry, as measured by <strong>the</strong> quantity of output per unit of input. Asingle comprehensive measure of productivity requires comprehensive measures of output and input. For <strong>the</strong>airline industry, TKP, including both passenger and freight traffic, is a good measure of output. However, <strong>the</strong>measurement of productivity is complicated by <strong>the</strong> diversity of inputs, which include aircraft, labour and fuel,among o<strong>the</strong>r resources, and also by <strong>the</strong> complexity of <strong>the</strong> production process. Several partial productivitymeasures <strong>for</strong> <strong>the</strong> aggregated operations of international scheduled airlines are shown in Table 2-3. <strong>Air</strong>craftproductivity refers <strong>to</strong> <strong>the</strong> quantity of TKPs that are obtained from <strong>the</strong> <strong>to</strong>tal payload of <strong>the</strong> scheduled airline fleet.Improvements in <strong>the</strong> average load fac<strong>to</strong>r (<strong>the</strong> percentage of <strong>the</strong> capacity provided by aircraft flights that isoccupied with revenue-earning passengers and freight), aircraft speed, and aircraft utilization (<strong>the</strong> extent <strong>to</strong> whichaircraft are kept flying on revenue-earning missions) have all contributed <strong>to</strong> growth in aircraft productivity,although increased aircraft utilization has had by far <strong>the</strong> largest impact over <strong>the</strong> past four decades. The threecomponents of aircraft productivity have been combined in<strong>to</strong> a single measure of aircraft productivity whosetrend is included among those illustrated in Figure 2-7. There have been some fluctuations in per<strong>for</strong>mance related<strong>to</strong> business cycle conditions. Over <strong>the</strong> whole 42-year period, aircraft productivity has advanced at an averageannual rate of about 2.9 per cent.18. Estimates <strong>for</strong> labour productivity, in terms of TKP per employee, are also given in Table 2-3, and <strong>the</strong>trend in labour productivity is also illustrated in Figure 2-7. The introduction of labour-saving technology andsystems has resulted in an impressive 5.9 per cent per annum growth (on average) since 1960. The impact ofimprovements in aircraft and engine design is also seen in <strong>the</strong> improvement in fuel productivity which has grownat an average rate of about 2.3 per cent per annum over <strong>the</strong> same period.19. Productivity benefits have come from economies of scale as well as from <strong>the</strong> adoption of new technology.Some of <strong>the</strong> scale economies are closely related <strong>to</strong> <strong>the</strong> new technology. In <strong>the</strong> 1960s, <strong>the</strong> new jets were muchlarger than <strong>the</strong> propeller aircraft <strong>the</strong>y were replacing. The next generation of jet aircraft, which began replacing<strong>the</strong> early jets in <strong>the</strong> 1970s, were larger again. <strong>Air</strong>craft size increased from an average capacity of nine <strong>to</strong>nnes in1960 <strong>to</strong> over 27 <strong>to</strong>nnes in 2002. Average aircraft size has not changed much since 1985.20. An overall index of airline productivity has been derived by combining <strong>the</strong> indices <strong>for</strong> aircraft, labour andfuel productivity in<strong>to</strong> a single average measure (presented in para. 23). The average growth in this measure wasabout 5.2 per cent per annum between 1960 and 2002.Table 2-3. Productivity of international scheduled airlines World (1965–2002)(ICAO Contracting States)Average levelsProductivity measure 1965 1975 1985 1995 2002<strong>Air</strong>craft productivity<strong>Air</strong>craft load fac<strong>to</strong>r (per cent) 52 50 59 60 62<strong>Air</strong>craft speed (km/h) 469 619 634 644 648<strong>Air</strong>craft utilization (hours per aircraft per year) 1 678 2 064 2 179 2 751 3 001Labour productivityTKP per employee (thousands) 43 82 144 258 320Fuel productivityTKP per litre of fuel (index) 100 123 187 213 234Note: Excluding operations of airlines registered in <strong>the</strong> CIS.Source: ICAO
Chapter 2. <strong>Air</strong> <strong>Transport</strong> Trends and Challenges 131 2001 000Index800600Labour productivity400<strong>Air</strong>craft productivity200Fuel productivity01960 63 66 69 72 75 78 81 84 87 90 93 96 99 2002Source: ICAO, BACK Aviation Associates, IMF, OECD.Figure 2-7. Trends in airline productivity — World (1960–2002)RELATIONSHIP BETWEEN PRODUCTIVITY, PRICES ANDFINANCIAL PERFORMANCE21. Having estimated <strong>the</strong> improvement in productivity per<strong>for</strong>mance achieved by <strong>the</strong> airline industry, <strong>the</strong>questions of how <strong>the</strong> improved productivity was used and who received <strong>the</strong> benefits can be addressed. Byreducing <strong>the</strong> quantities of inputs required <strong>to</strong> produce a unit of output, productivity growth has <strong>the</strong> effect ofreducing <strong>the</strong> cost per unit of output. These cost reductions may be used ei<strong>the</strong>r <strong>to</strong> reduce real fares and rates paidby passengers and shippers or <strong>to</strong> provide airlines with improved financial results.22. Changes in <strong>the</strong> real prices paid <strong>for</strong> inputs (e.g. labour and fuel) purchased by <strong>the</strong> airlines are also reflectedin <strong>the</strong> cost per unit of output, and hence in real fares and rates or in financial per<strong>for</strong>mance. The price trends of twoof <strong>the</strong> most important inputs, labour and jet fuel, are indicated in Figure 2-8, which also shows <strong>the</strong> trend in <strong>the</strong>Consumer Price Index (CPI). International Monetary Fund (IMF) indices <strong>for</strong> industrial countries are used <strong>for</strong> <strong>the</strong>labour price and <strong>the</strong> CPI. The importance of labour cost in <strong>the</strong> <strong>to</strong>tal cost structure of airlines and <strong>the</strong> high rate ofincrease in wage rates suggested in <strong>the</strong> figure have <strong>to</strong>ge<strong>the</strong>r acted as a powerful incentive <strong>for</strong> <strong>the</strong> improvement inlabour productivity observed in Figure 2-7. Fuel is ano<strong>the</strong>r key item on <strong>the</strong> expense side of <strong>the</strong> accounts. Theimpact on expenses of <strong>the</strong> very large fuel price increases in 1973–74 and 1979–80 was partly reversed by <strong>the</strong>price declines in 1985. Fur<strong>the</strong>r hikes in jet fuel prices occurred in 1990, 1996 and most recently in <strong>the</strong> year 2000when <strong>the</strong> average annual price in U.S. dollars reached 85 cents per gallon. Due <strong>to</strong> a contraction in demand, <strong>the</strong> jetfuel price softened <strong>to</strong> 69 cents on average in 2002 easing <strong>the</strong> pressure on airline operating costs. During <strong>the</strong> 1990s,fuel and oil costs ranged from around 10 <strong>to</strong> 15 per cent of <strong>to</strong>tal operating costs of scheduled airlines.23. The trends in productivity, input prices, yields (i.e. fares and rates), and financial per<strong>for</strong>mance aresummarized in Figure 2-9. A log scale is used so that <strong>the</strong> slopes of <strong>the</strong> trend lines represent percentage changes.
14 <strong>Outlook</strong> <strong>for</strong> <strong>Air</strong> <strong>Transport</strong> <strong>to</strong> <strong>the</strong> <strong>Year</strong> <strong>2015</strong>1 2001 000Index80060040020001960 63 66 69 72 75 78 81 84 87 90 93 96 99 2002Source: IMF, OECD, Energy In<strong>for</strong>mation Administration of US Department of Energy.Figure 2-8. Input price trends — World (1960–2002)100ProductivityIndex (log scale)10Revenue/expenseReal input priceReal yield11960 63 66 69 72 75 78 81 84 87 90 93 96 99 2002Source: IMF, ICAO Reporting Forms A-1 and EF-1.Figure 2-9. Trends in airline industry per<strong>for</strong>mance — World (1960–2002)
Chapter 2. <strong>Air</strong> <strong>Transport</strong> Trends and Challenges 15The productivity measure is <strong>the</strong> overall index referred <strong>to</strong> above. An overall input price index has also beendeveloped from individual input prices. Input prices and yields are expressed in real terms (i.e. after removing <strong>the</strong>impact of general inflation). Financial per<strong>for</strong>mance is represented by <strong>the</strong> ratio of revenues <strong>to</strong> expenses, whereexpenses are defined <strong>to</strong> exclude taxes and interest.24. By and large, <strong>the</strong> productivity gains have not been retained by <strong>the</strong> airlines over <strong>the</strong> long term. Most of <strong>the</strong>cost savings associated with <strong>the</strong> full range of labour, fuel and aircraft productivity improvements have beenpassed on <strong>to</strong> <strong>the</strong> consumer in <strong>the</strong> <strong>for</strong>m of lower fares and rates. The impact of productivity improvements hasbeen offset <strong>to</strong> some extent by <strong>the</strong> increases in real input prices in <strong>the</strong> 1970s. A slight increase in <strong>the</strong>se prices canalso be observed in recent years which can be mainly attributed <strong>to</strong> <strong>the</strong> fuel price hike in 2000. In contrast, labourprices in <strong>the</strong> airline industry have had a reverse trend since 2001 due <strong>to</strong> traffic declines, both when compared <strong>to</strong>o<strong>the</strong>r operational cost items and <strong>the</strong> overall labour price index (<strong>for</strong> industrialized countries).25. Although <strong>the</strong>re have been substantial changes in <strong>the</strong> operating results of <strong>the</strong> airline industry in <strong>the</strong> shortand medium terms (see Chapter 4), <strong>the</strong>re has been nei<strong>the</strong>r an improving nor declining trend in financialper<strong>for</strong>mance over <strong>the</strong> long term. A significant sustained upward or downward trend would not be expectedbecause of <strong>the</strong> magnified impact such a trend would have on <strong>the</strong> levels of industry profits or losses.SAFETY AND QUALITY OF SERVICE26. <strong>Air</strong> transport has a strong tradition of giving <strong>to</strong>p priority <strong>to</strong> safety. While <strong>the</strong> traffic growth, productivityimprovement and cost and yield reductions described above have been occurring, a substantial improvement in<strong>the</strong> safety of air travel has been achieved. The number of passenger fatalities per 100 millionpassenger-kilometres flown has fallen from 0.8 in 1960 <strong>to</strong> 0.08 in 1980, 0.03 in 1990 and has ranged between0.05 and 0.02 since <strong>the</strong>n. The year 2002 saw 0.03 passenger fatalities per 100 million passenger-kilometres flown.27. There have also been significant enhancements in <strong>the</strong> quality of service provided <strong>to</strong> airline cus<strong>to</strong>mers.There are many dimensions <strong>to</strong> <strong>the</strong> quality of service, including journey time, convenience and reliability ofservice, com<strong>for</strong>t in <strong>the</strong> aircraft cabin and <strong>the</strong> range of on-board facilities. Some of <strong>the</strong>se fac<strong>to</strong>rs are difficult <strong>to</strong>measure in an objective fashion. However, increases in aircraft speed and average stage length have beenachieved, with positive consequences <strong>for</strong> journey times and passenger convenience. The global averageblock-<strong>to</strong>-block aircraft speed increased from 360 kilometres per hour (km/h) in 1960 <strong>to</strong> 630 km/h in 1980 and648 km/h in 2002 (an increase of 80 per cent over 1960). There has been little change in block speed since 1980.The average stage length has more than doubled from 470 kilometres in 1960 <strong>to</strong> 1 193 kilometres in 2002. Thislatter trend has been associated with more direct flights and fewer s<strong>to</strong>povers <strong>for</strong> refuelling, and hence a greaterlevel of convenience <strong>for</strong> <strong>the</strong> passenger. The combined effect of increased aircraft speeds and fewer s<strong>to</strong>poversreduced <strong>the</strong> <strong>to</strong>tal journey time from Sydney <strong>to</strong> London from three and a half days in 1950 <strong>to</strong> under one day in2002. Over <strong>the</strong> same period, <strong>the</strong> average journey time from New York <strong>to</strong> London was reduced from 17 hours <strong>to</strong>just under 7 hours.28. With <strong>the</strong> growth in air transport demand in response <strong>to</strong> fac<strong>to</strong>rs such as overall economic development,airlines have been able <strong>to</strong> increase service frequency and introduce non-s<strong>to</strong>p flights <strong>for</strong> a greater range ofcity-pairs without increasing costs. This improved service has, in turn, led <strong>to</strong> stimulation of demand in <strong>the</strong> longrun, although <strong>the</strong>re have also been short-term demand contractions due <strong>to</strong> so-called fear and hassle fac<strong>to</strong>rs ando<strong>the</strong>r non-economic fac<strong>to</strong>rs. While it is not possible <strong>to</strong> isolate cause and effect, <strong>the</strong> fact that aircraft departureshave increased by around 203 per cent between 1960 and 2002 is evidence of improvement in service frequencyand convenience.
16 <strong>Outlook</strong> <strong>for</strong> <strong>Air</strong> <strong>Transport</strong> <strong>to</strong> <strong>the</strong> <strong>Year</strong> <strong>2015</strong>AIRPORT AND AIRSPACE CONGESTION29. During <strong>the</strong> 1980s, growth in passenger numbers of over 50 per cent and in aircraft departures of about35 per cent resulted in airport and airspace congestion in some regions. A pause in traffic growth and measures <strong>to</strong>increase capacity provided some relief in <strong>the</strong> early 1990s. However, <strong>the</strong> subsequent resumption of traffic growthin <strong>the</strong> late 1990s put pressure again on facilities. This came <strong>to</strong> a halt in <strong>the</strong> early 2000s, with <strong>the</strong> combination ofterrorist events and <strong>the</strong> general economic slowdown, which resulted in a delay of about five years in airport trafficgrowth. However, in some regions, traffic congestion still exists and at some major airports <strong>the</strong> limits of terminaland runway expansion are being reached. The land-intensive characteristics of airports and <strong>the</strong>ir environmentalimpact are serious barriers <strong>to</strong> <strong>the</strong> provision of extra runway capacity and, <strong>to</strong> a lesser extent, terminal capacity.Fur<strong>the</strong>rmore, many air traffic control systems are aging and in need of upgrading.30. Technological developments and investment in aircraft, airports and air navigation equipment will createmore capacity in <strong>the</strong> air transport system <strong>to</strong> help meet future demand. A number of new airports, as well as airportexpansion projects, are due <strong>for</strong> completion over <strong>the</strong> next few years; much of this activity is in <strong>the</strong> Asia/Pacific,European and North American regions. Implementation of <strong>the</strong> global air navigation system under <strong>the</strong> leadershipof ICAO is expected <strong>to</strong> lead <strong>to</strong> significant improvements in <strong>the</strong> management of air traffic in all phases of flight.31. There are also various technical procedures, such as revisions <strong>to</strong> separation criteria, that can improve <strong>the</strong>flow of air traffic and reduce congestion delays. The provision of access and exit taxiways can increase runwaycapacity. In regard <strong>to</strong> congestion inside terminals, a number of States are reaching <strong>the</strong> goals of ICAO’sfacilitation programme such as clearing all arriving passengers (requiring normal inspection) throughinternational airports within 45 minutes. The progressive introduction of machine readable travel documents and<strong>the</strong> general streamlining of procedures will be of increasing importance in <strong>the</strong> continuing search <strong>for</strong>improvements.32. These are essentially supply-side measures which can effectively increase <strong>the</strong> capacity of <strong>the</strong>infrastructure. O<strong>the</strong>r policies under consideration include pricing structures and regula<strong>to</strong>ry controls, such as slotallocation, which act on <strong>the</strong> demand side.33. The continuing development of high-speed rail services in Europe, in Japan and, <strong>to</strong> a limited extent, in<strong>the</strong> United States is expected <strong>to</strong> draw some air traffic from congested facilities.34. The increasing use of secondary airports in major urban areas is providing relief, as well as a degree ofcompetition, <strong>to</strong> large airports by diverting traffic from high-density flows but, at <strong>the</strong> same time, is adding aircraftmovements, usually per<strong>for</strong>med by smaller aircraft, <strong>to</strong> air traffic management systems.ENVIRONMENTAL PROTECTION35. Future growth in civil aviation will take place against a background of increasing public concernregarding <strong>the</strong> environment, particularly with regard <strong>to</strong> aircraft noise and <strong>the</strong> impact of aircraft engine emissions.36. Noise levels near airports are subject <strong>to</strong> two opposing trends: <strong>the</strong> replacement of noisy aircraft by quieterones and <strong>the</strong> increasing number of aircraft movements. ICAO has developed noise certification Standards(Annex 16, Volume I) and in 1990 adopted a worldwide policy enabling States <strong>to</strong> introduce operating restrictionson <strong>the</strong> older, noisier (“Chapter 2”) aircraft covered by <strong>the</strong>se standards. The phase-out of Chapter 2 aircraft hasnow been completed at most airports where aircraft noise is a problem and governments have been turning <strong>the</strong>irattention <strong>to</strong> concerns that <strong>the</strong> rapid growth of air transport could increase noise levels once again. With a view <strong>to</strong>addressing <strong>the</strong>se concerns, <strong>the</strong> ICAO Assembly in 2001 endorsed <strong>the</strong> concept of a “balanced approach” <strong>to</strong> aircraft
Chapter 2. <strong>Air</strong> <strong>Transport</strong> Trends and Challenges 17noise management. This consists of identifying <strong>the</strong> noise problem at an airport and <strong>the</strong>n analysing <strong>the</strong> variousmeasures available <strong>to</strong> reduce noise through <strong>the</strong> exploration of four principal elements, namely reduction at source(quieter aircraft), land-use planning and management, noise abatement operational procedures, and operatingrestrictions, with <strong>the</strong> goal of addressing <strong>the</strong> noise problem in <strong>the</strong> most cost-effective manner. In 2006, a new,more stringent ICAO standard will apply (“Chapter 4”).37. As regards aircraft engine emissions, initially <strong>the</strong> main concern was <strong>the</strong> impact on air quality in <strong>the</strong>vicinity of airports, as a result of which ICAO developed Standards <strong>for</strong> <strong>the</strong> control of gaseous emissions throughan engine certification scheme (Annex 16, Volume II). More recently, <strong>the</strong>re have been increasing concerns that<strong>the</strong>se emissions may be contributing <strong>to</strong> global atmospheric problems. The principal issue is aviation’scontribution <strong>to</strong> climate change. In 1999, <strong>the</strong> Intergovernmental Panel on Climate Change (IPCC) prepared aSpecial Report on Aviation and <strong>the</strong> Global Atmosphere 1 which estimated that aircraft contribute about 3.5 percent of <strong>the</strong> <strong>to</strong>tal radiative <strong>for</strong>cing 2 by all human activities. The emissions from aircraft of relevance <strong>for</strong> climatechange include carbon dioxide (CO 2 ), water vapour, nitrogen oxides (NO x ), sulphur oxides and soot.38. The Kyo<strong>to</strong> Pro<strong>to</strong>col <strong>to</strong> <strong>the</strong> UN Framework Convention on Climate Change (UNFCCC), which wasadopted in 1997 but has not yet entered in<strong>to</strong> <strong>for</strong>ce, requires industrialized countries <strong>to</strong> reduce <strong>the</strong>ir collectiveemissions of certain greenhouse gases, <strong>the</strong> one most relevant <strong>to</strong> aviation being CO 2 . The Kyo<strong>to</strong> Pro<strong>to</strong>col also calls<strong>for</strong> industrialized countries, working through ICAO, <strong>to</strong> limit or reduce emissions from international aviation.39. Future concerns about aviation’s role in both climate change and local air quality are largely due <strong>to</strong> <strong>the</strong>projected continued growth. Because of improvements in fuel productivity, growth rates <strong>for</strong> emissions are lessthan those <strong>for</strong> traffic growth. While fuel productivity improvement is expected <strong>to</strong> continue, <strong>the</strong>re are no easytechnical “fixes” <strong>for</strong> aviation and <strong>to</strong>tal emissions will continue <strong>to</strong> increase. In <strong>the</strong> case of CO 2 (which is notcontrolled by <strong>the</strong> present Standards), improvements can only be achieved by reducing <strong>the</strong> rate of fuelconsumption. Operational measures, as well as <strong>the</strong> use of market-based options such as voluntary agreements,emissions trading or emission-related levies (charges or taxes), are all under consideration.FINANCIAL RESOURCES40. Investment in new aircraft generally follows a cyclical pattern. The latter part of <strong>the</strong> 1980s was a periodof high investment. Investment levels fell away during <strong>the</strong> recession of <strong>the</strong> early 1990s but began <strong>to</strong> build upagain in <strong>the</strong> latter part of <strong>the</strong> 1990s. The expected future funding requirement over <strong>the</strong> long term is substantiallylarger, in real terms, than was required over comparable periods in <strong>the</strong> past. This is consistent with <strong>the</strong> ongoinggrowth in traffic that is <strong>for</strong>ecast over <strong>the</strong> long term.1. This Report has a Summary <strong>for</strong> Policymakers which is available in six UN languages (Arabic, Chinese, English, French, Russianand Spanish) and is accessible at IPCC’s Web site (www.ipcc.ch). The report itself (over 300 pages) is published in English onlyand can be purchased from Cambridge University Press (www.cup.cam.ac.UK).2. Radiative <strong>for</strong>cing is a measure of <strong>the</strong> importance of a potential climate change mechanism.
18 <strong>Outlook</strong> <strong>for</strong> <strong>Air</strong> <strong>Transport</strong> <strong>to</strong> <strong>the</strong> <strong>Year</strong> <strong>2015</strong>41. The world passenger fleet is <strong>for</strong>ecast <strong>to</strong> reach almost 22 000 aircraft by <strong>the</strong> year <strong>2015</strong> 3 <strong>to</strong> meet <strong>the</strong>projected demand <strong>for</strong> new aircraft and replacement of retired aircraft. It is estimated that some 13 000 newaircraft will be added <strong>to</strong> <strong>the</strong> world fleet and just over 3 300 aircraft in <strong>the</strong> current fleet will be removed frompassenger services during <strong>the</strong> same period. The freighter fleet is expected <strong>to</strong> reach almost 2 500 aircraft by <strong>2015</strong>,of which almost 300 aircraft will be new freighters, while <strong>the</strong> remainder are expected <strong>to</strong> be converted frompassenger operations.ECONOMIC REGULATION42. For <strong>the</strong> past decade, <strong>the</strong>re have been significant developments in <strong>the</strong> air transport regula<strong>to</strong>ry scene at <strong>the</strong>national, bilateral, regional and multilateral levels. Much progress has been made in <strong>the</strong> liberalization ofinternational air transport regulation with an increasing number of States being parties <strong>to</strong> arrangements <strong>to</strong>wardsfull market access.43. At <strong>the</strong> national level, several States have launched a review process of <strong>the</strong>ir air transport policies in ligh<strong>to</strong>f <strong>the</strong> global trend <strong>to</strong>ward increased liberalization. Some of <strong>the</strong>se policies seek <strong>to</strong> liberalize air transport services,in whole or in part, on a unilateral basis without requiring comparable rights from bilateral partners in return.O<strong>the</strong>rs aim at liberalizing domestic air transport markets and also at permitting more carriers <strong>to</strong> fly internationalroutes. In addition, about 130 States have announced privatization plans or expressed <strong>the</strong>ir intentions ofprivatization <strong>for</strong> approximately 190 State-owned airlines as part of <strong>the</strong> broader trends associated withglobalization and liberalization across all economic sec<strong>to</strong>rs, although achievement of privatization has not beeneasy. Some States have also adopted a new policy or amended existing rules on <strong>for</strong>eign investment or control innational airlines and relaxed air carrier ownership and control conditions.44. At <strong>the</strong> bilateral level, over 70 per cent of bilateral air services agreements which were recently concludedor amended contained some <strong>for</strong>m of liberalized arrangements such as unrestricted traffic rights (covering Third,Fourth and in some cases Fifth Freedom rights), multiple designation with or without route limitations, freedetermination of capacity, a liberal double disapproval or country-of-origin tariff regime, and broadened criteria<strong>for</strong> air carrier ownership and control. One notable development is <strong>the</strong> considerable increase in <strong>the</strong> number of“open skies” agreements, which provide <strong>for</strong> full market access without restrictions on designations, route rights,capacity, frequencies, codesharing and tariffs. Over <strong>the</strong> past decade, over 85 such open skies agreements wereconcluded between some 70 States. These agreements involved not only developed countries but also anincreasing number of developing countries (involved in about 60 per cent of <strong>the</strong> agreements).45. At <strong>the</strong> regional level, 11 groups of States have created liberalization regimes on a regional basis or amonga group of like-minded States; a few examples being <strong>the</strong> European Union (EU), <strong>the</strong> Andean Pact, <strong>the</strong>Yamoussoukro II Ministerial decision, and <strong>the</strong> Multilateral Agreement on <strong>the</strong> Liberalization of International <strong>Air</strong><strong>Transport</strong>ation (MALIAT) known as <strong>the</strong> “Kona” open skies agreement. There are also several o<strong>the</strong>r potentialarrangements under development throughout <strong>the</strong> world. These regional and/or plurilateral liberalizationarrangements have <strong>the</strong> basic objective of providing greater market access and improving services among <strong>the</strong>Member States concerned. Small groups of States of comparable size and development may find it easier <strong>to</strong> agreeon market access than larger, diverse groups of States. The small groups would also provide a more manageableenvironment <strong>to</strong> test liberalized air transport policies.3. Source: ICAO Committee on Aviation Environmental Protection (CAEP), Sixth Meeting, Montreal 2–12/2/04, In<strong>for</strong>mationPaper CAEP/6-IP/13 dated 15/1/04 presented by <strong>the</strong> Forecasting and Economic Analysis Support Group (FESG) which includestraffic and fleet <strong>for</strong>ecasts.
Chapter 2. <strong>Air</strong> <strong>Transport</strong> Trends and Challenges 1946. Within <strong>the</strong> EU, <strong>the</strong>re was a significant development creating a new negotiating dynamic involving airservices agreements by third parties with <strong>the</strong> EU member States, following <strong>the</strong> judgements of <strong>the</strong> European Cour<strong>to</strong>f Justice in November 2002, which ruled against certain provisions in some EU members’ open skiesagreements with <strong>the</strong> United States. In June 2003, <strong>the</strong> Council of <strong>the</strong> European Union conferred on <strong>the</strong> EuropeanCommission a mandate <strong>to</strong> negotiate air services agreements on behalf of all member States with <strong>the</strong> United States<strong>for</strong> creation of an Open Aviation Area (OAA) between <strong>the</strong> two terri<strong>to</strong>ries, as well as <strong>to</strong> negotiate with certainthird countries on <strong>the</strong> replacement of certain specific provisions in <strong>the</strong> existing agreements.47. At <strong>the</strong> multilateral level, <strong>the</strong> World Trade Organization (WTO-OMC) came in<strong>to</strong> being in January 1995and <strong>the</strong> General Agreement on Trade in Services (GATS) entered in<strong>to</strong> <strong>for</strong>ce. The GATS Annex on <strong>Air</strong> <strong>Transport</strong>Services applies trade rules and principles such as most-favoured nation (MFN) treatment and national treatment<strong>to</strong> three specific so-called “soft” rights, namely, aircraft repair and maintenance, selling and marketing of airtransport, and computer reservation system (CRS) services. It excludes from <strong>the</strong> application of <strong>the</strong> GATS“services directly related <strong>to</strong> <strong>the</strong> exercise of traffic rights”. Pursuant <strong>to</strong> an earlier ministerial decision, <strong>the</strong>WTO-OMC launched in 2000 <strong>the</strong> first review of <strong>the</strong> operation of this Annex with a view <strong>to</strong> considering possibleextension of its coverage in this sec<strong>to</strong>r. In 2003, however, <strong>the</strong> first review was concluded with <strong>the</strong> result that <strong>the</strong>Annex remains unchanged, and <strong>the</strong> next review would commence <strong>to</strong>wards <strong>the</strong> end of 2005.48. O<strong>the</strong>r more general regula<strong>to</strong>ry measures also affect air transport. Such measures include competition law,<strong>the</strong> imposition of various taxes, <strong>the</strong> expansion of airline responsibilities associated with national entryrequirements (particularly <strong>for</strong> inadmissible passengers), more stringent health standards <strong>for</strong> entry particularlywhere prevention of <strong>the</strong> spread of Acquired Immune Deficiency Syndrome (AIDS) and Severe Acute Respira<strong>to</strong>rySyndrome (SARS) is sought, and national narcotics control ef<strong>for</strong>ts.INDUSTRY STRUCTURE49. Traditionally, changes in airline industry structure arise from <strong>the</strong> need <strong>to</strong> meet growing demand <strong>for</strong> airtransport services in increasingly competitive but less regulated markets and a more globalized economicenvironment.50. Mega-carriers in <strong>the</strong> United States and elsewhere operate out of <strong>the</strong>ir home base airports applying <strong>the</strong>“hub and spoke” system which employs large banks or complexes of interconnecting flights <strong>to</strong> maximize <strong>the</strong>number of city-pair markets that can be served by each flight. This operational approach arose from a perceivedneed <strong>to</strong> operate several hubs and <strong>to</strong> achieve critical mass (i.e. a size sufficient <strong>to</strong> exploit economies of scope anddensity, and <strong>the</strong> ability <strong>to</strong> influence market conditions). However, <strong>the</strong> hub-and-spoke concept has recently comeunder scrutiny as one of <strong>the</strong> measures taken by airlines <strong>to</strong> reduce airport services costs by utilizing staff, gates andaircraft more productively; <strong>for</strong> instance, American <strong>Air</strong>lines began <strong>to</strong> de-peak at its two hubs Dallas/Fort Worth(Texas) and Chicago O’Hare (Illinois).51. <strong>Air</strong>lines are making increased use of computer-based measures <strong>to</strong> improve productivity and optimizerevenues, including <strong>the</strong> use of au<strong>to</strong>mated systems <strong>for</strong> yield management and <strong>for</strong> marketing, sales andcommunication. First, <strong>the</strong> development of sophisticated yield management systems, associated with <strong>the</strong> use ofcomputers, has enabled airlines <strong>to</strong> adjust <strong>the</strong> mix of high- and low-fare passengers on each flight in order <strong>to</strong>maximize revenues as well as <strong>to</strong> allocate seats efficiently. Yield management has enabled established higher-costairlines in certain instances <strong>to</strong> compete selectively with new lower-cost airlines that are often reliant upon lowfares <strong>to</strong> achieve market penetration. Second, product distribution is now being carried out through CRS.
20 <strong>Outlook</strong> <strong>for</strong> <strong>Air</strong> <strong>Transport</strong> <strong>to</strong> <strong>the</strong> <strong>Year</strong> <strong>2015</strong>Product distribution52. An important development in <strong>the</strong> airline distribution and sales area which combines computers andpersonal communication systems is direct sales <strong>to</strong> consumers, including via <strong>the</strong> Internet. Although <strong>the</strong> majority ofairline ticket sales are still being achieved through traditional travel agents, <strong>the</strong> share of on-line sales through <strong>the</strong>Internet is growing fast, especially in countries where Internet and credit card use is high. This development hascreated new opportunities as well as challenges <strong>for</strong> airlines and CRS vendors. Many airlines have started orexpanded on-line sales as a way of cutting distribution costs. Some have joined <strong>for</strong>ces <strong>to</strong> create travel Web sitesin order <strong>to</strong> maximize <strong>the</strong> benefits of electronic commerce. The four global CRS vendors, Amadeus, Galileo, Sabreand Worldspan, have also taken actions <strong>to</strong> adjust <strong>to</strong> <strong>the</strong> new business environment and pursued <strong>the</strong> Internetmarket through different strategies, evolving in<strong>to</strong> global distribution systems (GDSs). GDS providers offercomprehensive in<strong>for</strong>mation and reservation services and e-commerce solutions <strong>for</strong> travel and <strong>to</strong>urism (air travel,car rentals, rail-links, hotels, leisure facilities, etc.). Some have provided reservation services <strong>to</strong> major on-linetravel sites or have become owners of such sites; o<strong>the</strong>rs have <strong>for</strong>ged partnerships with retail giants <strong>for</strong> joint Websites. Ano<strong>the</strong>r important development in this area is electronic ticketing, initially offered <strong>for</strong> domestic flights in<strong>the</strong> United States but now becoming available <strong>for</strong> international flights in all regions. In an era of increasedcompetition, <strong>the</strong>se developments offer considerable cost savings <strong>for</strong> airlines, as well as diversification of <strong>the</strong>irdistribution outlets.Alliances and airline cooperation53. The <strong>for</strong>mation of alliances as well as joint marketing arrangements among airlines is a relatively recentbut rapidly evolving phenomenon implemented <strong>to</strong> achieve and improve market access (albeit indirectly) andsynergies (<strong>for</strong> example, circumventing bilateral restrictions on market access, ownership and control). Currently,over 600 such voluntary interline alliance agreements exist worldwide, containing a variety of elements such ascodesharing, blocked space, cooperation in marketing, pricing, inven<strong>to</strong>ry control and frequent flyer programmes(FFPs), coordination in scheduling, sharing of offices and airport facilities, joint ventures and franchising. Among<strong>the</strong> transnational groupings, <strong>the</strong>re are four competing “global alliances”, namely Star Alliance, oneworld,SkyTeam and Wings. Each group is composed of some major airline members having different geographicalcoverage with fairly extensive networks. Through <strong>the</strong> alliances, <strong>the</strong>se carriers have combined <strong>the</strong>ir route networks,which extend <strong>to</strong> most parts of <strong>the</strong> world, and carry <strong>to</strong>ge<strong>the</strong>r over 50 per cent of worldwide scheduled passengertraffic. Strategic alliances are airlines’ response <strong>to</strong>, inter alia, perceived regula<strong>to</strong>ry constraints, a need <strong>to</strong> reduce<strong>the</strong>ir costs through economies of scope and scale, and more globalized and competitive air transport markets. InEurope and North America, intermodal alliances with railways have also grown.54. These developments have caused concerns <strong>to</strong> small- and medium-size airlines <strong>for</strong> <strong>the</strong>ir survival and haveprompted ef<strong>for</strong>ts by <strong>the</strong>se airlines <strong>to</strong> develop a particular segment of a market, <strong>to</strong> compete as low-cost,point-<strong>to</strong>-point airlines or <strong>to</strong> enter various alliances of <strong>the</strong>ir own.<strong>Air</strong>line business models55. In recent years, successful low-cost carriers have been challenging <strong>the</strong> full service network models ofmajor airlines. The common features of <strong>the</strong> business model of low-cost carriers are, with some variations:point-<strong>to</strong>-point network focusing on short-haul routes, high frequencies, simple low-fare structures, high-densitysingle class with no seat assignment, simple in-flight services, staffing flexibility and minimal overheads, andintensive use of electronic commerce <strong>for</strong> marketing and distribution (including on-line booking via <strong>the</strong> Internetand electronic ticketing). To sustain low-cost structures, <strong>the</strong>se carriers usually operate a single aircraft type withhigh daily aircraft utilization. They also use less-congested secondary airports <strong>to</strong> ensure quick turnarounds andpunctuality and <strong>to</strong> reduce airport-related costs. Low operating costs enable low-cost carriers <strong>to</strong> allocate all <strong>the</strong>irseats <strong>to</strong> low fares. The success of low-cost, point-<strong>to</strong>-point air carriers has prompted some larger carriers <strong>to</strong> createsubsidiaries or separate units <strong>to</strong> compete with <strong>the</strong>m.
Chapter 2. <strong>Air</strong> <strong>Transport</strong> Trends and Challenges 2156. In <strong>the</strong> area of air cargo, <strong>the</strong> highly sophisticated airline/parcel express delivery companies, which grewsubstantially in <strong>the</strong> past decade, continue <strong>to</strong> expand this specialized service. These companies operate large jetcargo fleets combined with surface delivery systems <strong>to</strong> provide continental overnight deliveries and second dayintercontinental services via strategically placed sorting hubs. This concept has also been adopted by a number ofpostal administrations.Privatization, national consolidation and transnational ownership57. Privatization of State-owned airlines has been one of <strong>the</strong> preeminent trans<strong>for</strong>mations in international airtransport, where airlines in all but a handful of States had been State-owned until recent times. It is a process ofdivestment, by various methods, of State-owned or -controlled equity and may be carried out in a phased mannerover time. Some States may consider a minor sale of shares as privatization. The motives <strong>for</strong> privatization havebeen highly diverse, ranging from purely economic considerations or improving operating efficiency andcompetitiveness <strong>to</strong> a more pragmatic desire <strong>to</strong> reduce <strong>the</strong> heavy financial burden <strong>for</strong> States <strong>for</strong> financing capitalinvestment in new equipment. Whatever <strong>the</strong> reasons, <strong>the</strong> privatization of airlines has accompanied a morecommercially-oriented outlook within an increasingly competitive environment. Since 1985, about 130 Stateshave announced privatization plans or expressed <strong>the</strong>ir intentions of privatization <strong>for</strong> approximately 190State-owned airlines. During this period, about 90 of <strong>the</strong>se targeted carriers have achieved privatization goals.58. <strong>Air</strong>lines in many parts of <strong>the</strong> world have continued <strong>the</strong> pursuit of enhanced market strength throughmergers, acquisitions or operational integration under a single holding company. The common thread of this trendis <strong>the</strong> continuing development of growth strategies designed <strong>to</strong> hold and expand existing market share, gainaccess <strong>to</strong> new markets, achieve unit cost reduction, shield <strong>the</strong>mselves against competition, and increase <strong>the</strong> scaleof operations in order <strong>to</strong> attain a critical market position. Mergers or acquisitions are easier <strong>to</strong> achieve within <strong>the</strong>same country, although some Governments have expressed concerns regarding industry consolidation and havescrutinized it.59. The opportunity <strong>for</strong> equity investment in <strong>for</strong>eign carriers has increased as many States adopted a newpolicy or amended existing rules on <strong>for</strong>eign investment or control in national airlines and relaxed air carrierownership and control conditions in air services agreements. However, most attempts <strong>to</strong> initiate transactionsinvolving a <strong>for</strong>eign majority ownership, including cross-border mergers or acquisitions, were abandoned owing <strong>to</strong>aeropolitical, economic and regula<strong>to</strong>ry complexities. Even in <strong>the</strong> implemented cases, <strong>the</strong> control and managemen<strong>to</strong>f <strong>for</strong>eign carriers was not financially risk-free. Because of <strong>the</strong>se difficulties in successful implementation, most<strong>for</strong>eign investments in <strong>the</strong> airline industry have been on a limited scale, instead of taking a majority stake orpursuing a full-scale merger, and often as part of a strategy <strong>to</strong> <strong>for</strong>ge or streng<strong>the</strong>n alliances and expand marketaccess. Never<strong>the</strong>less, <strong>for</strong>eign investments have sometimes been short-lived.___________________
Chapter 3WORLD ECONOMIC ENVIRONMENTHISTORICAL TRENDS1. As indicated in Chapter 2, <strong>the</strong> world economy is subject <strong>to</strong> economic cycles but has steadily grown over<strong>the</strong> long term. During <strong>the</strong> period 1960–2002, <strong>the</strong> aggregate world economy measured in terms of GDP increasedat an average annual rate of 3.4 per cent in real terms.2. Following <strong>the</strong> recession of 1980–1982, <strong>the</strong> world economy experienced its longest period of sustainedprogress (1983–1989) since <strong>the</strong> Second World War, achieving an average annual growth rate of 3.6 per centbe<strong>for</strong>e a slowdown in 1990, due primarily <strong>to</strong> fuel price increases in <strong>the</strong> wake of <strong>the</strong> Gulf crisis in <strong>the</strong> second halfof <strong>the</strong> year.3. However, <strong>the</strong> 1990 oil price increases did less damage <strong>to</strong> <strong>the</strong> world economy than did previous increasesin 1973 and 1980. The 1990 increases were smaller, and <strong>the</strong> ability of <strong>the</strong> economies of <strong>the</strong> industrializedcountries <strong>to</strong> cope with <strong>the</strong>m was greater because of reduced energy dependency and <strong>the</strong> effects of structuralre<strong>for</strong>ms in <strong>the</strong> 1980s. They also lasted <strong>for</strong> a shorter period, with both crude oil and jet fuel prices returning <strong>to</strong>pre-crisis levels by March 1991.4. World economic growth, measured in terms of real GDP, declined from almost 3.5 per cent in 1989 <strong>to</strong>0.7 per cent in 1990. In 1991, some major economies entered in<strong>to</strong> a recession or experienced a slowdown; as aresult, <strong>the</strong> world economy increased only by 0.1 per cent in 1991, <strong>the</strong> most difficult year globally since 1982. Theworld economy improved in 1992 and 1993, and over <strong>the</strong> period 1990–1995 it grew at an average annual rate of2.8 per cent. Having experienced high growth rates in 1996 and 1997 (3.5 and 3.7 per cent, respectively), <strong>the</strong>world economy slowed down in 1998, led by a turndown in <strong>the</strong> Asia/Pacific region, and increased only by 1.9 percent. It regained strength, however, in 1999 with GDP growth of 3.1 per cent, based mainly on economicrecovery in <strong>the</strong> Asia/Pacific region and continued strong growth in <strong>the</strong> United States economy, and continued <strong>to</strong>grow in 2000 at 4.6 per cent. Ano<strong>the</strong>r slowdown occurred during 2001 across almost all major regions resultingfrom a marked decline in trade growth, significantly lower commodity prices, and deteriorating financingconditions in emerging markets. The events of 11 September 2001 amplified <strong>the</strong> impact of an already weakeningglobal economy, particularly on consumer and business confidence in <strong>the</strong> United States; as a result, GDP growthdropped <strong>to</strong> 2.3 per cent. With trade and industrial production improving across all regions, <strong>the</strong> world economybegan <strong>to</strong> recover and grew at a rate of 3.0 per cent in 2002.5. World population growth between 1980 and 2002 increased at an average annual rate of 1.5 per cent.Hence, <strong>the</strong> world’s GDP per capita increased during <strong>the</strong> same period at an average annual rate of 1.2 per cent,lower than <strong>the</strong> growth of GDP itself. For <strong>the</strong> period 1992–2002, GDP and GDP per capita grew at an averageannual rate of 3.0 per cent and 1.6 per cent, respectively.OUTLOOK6. There appears <strong>to</strong> be consensus among economic <strong>for</strong>ecasters that <strong>the</strong> world economic and financialconditions are on a sustainable recovery path and that <strong>the</strong> global economy will continue <strong>to</strong> expand over <strong>the</strong>22
Chapter 3. World Economic Environment 23medium term. Apart from <strong>the</strong> negative impacts of <strong>the</strong> war in Iraq and <strong>the</strong> SARS outbreak in parts of Asia during<strong>the</strong> first half of 2003, <strong>the</strong> world economy began <strong>to</strong> show signs of a renewed recovery. It is estimated that <strong>the</strong>world GDP grew approximately 3.2 per cent in real terms in 2003, slightly higher than in 2002. For <strong>the</strong> years2004 and 2005, <strong>the</strong> world economy is anticipated <strong>to</strong> fur<strong>the</strong>r expand at 4.1 and 4.2 per cent, respectively.7. Figure 3-1 portrays <strong>the</strong> his<strong>to</strong>rical growth trends of GDP and GDP per capita in real terms from 1992–2002 and <strong>the</strong> prospects through <strong>to</strong> 2005. The outlook <strong>for</strong> 2003–05 is taken from <strong>the</strong> most recent three-year<strong>for</strong>ecasts on economic development and scheduled passenger traffic at <strong>the</strong> global and regional level that ICAOproduces and publishes in an annual series entitled The World of Civil Aviation.8. Over <strong>the</strong> long-term horizon <strong>to</strong> <strong>2015</strong>, <strong>the</strong> world economy is projected <strong>to</strong> grow at an average annual rate of2.5 per cent in real terms (see Chapter 5).6GDPGDP per capita42Per cent0–2–4ActualForecast1992 93 94 95 96 97 98 99 2000 01 02 03 04 2005Source: ICAO estimates based on data from <strong>the</strong> IMF, OECD, WEFA Group, World Bank and o<strong>the</strong>r sources.Figure 3-1. Growth of real GDP and GDP per capita — World (1992–2005)___________________
Chapter 4AIRLINE FINANCIAL TRENDSOPERATING REVENUES, EXPENSES AND RESULTSGlobal trends1. This chapter outlines general trends in airline financial data (in current terms unless indicated o<strong>the</strong>rwise)from <strong>the</strong> his<strong>to</strong>rical perspective and, in broad terms, <strong>the</strong> outlook <strong>to</strong> <strong>the</strong> year <strong>2015</strong>. Financial data <strong>for</strong> <strong>the</strong> years 1970,1980 and 1990 as well as <strong>for</strong> <strong>the</strong> period 1992–2002, categorized by major components of operating revenues andexpenses, are given in Table 4-1. The trends in annual operating revenues and expenses <strong>for</strong> <strong>the</strong> period 1992 <strong>to</strong>2002 are illustrated in Figure 4-1. The treatment is global in nature, dealing with <strong>to</strong>tals and averages <strong>for</strong> <strong>the</strong>airlines at <strong>the</strong> global level, and <strong>for</strong> this reason does not show <strong>the</strong> wide differences that exist between regions orindividual carriers. Since <strong>the</strong> available in<strong>for</strong>mation on non-scheduled opera<strong>to</strong>rs is incomplete, <strong>the</strong> analysis isconfined <strong>to</strong> <strong>the</strong> scheduled airlines of ICAO Contracting States (although <strong>the</strong> non-scheduled operations of <strong>the</strong>seairlines are included).2. The long-term his<strong>to</strong>rical trend of <strong>the</strong> financial per<strong>for</strong>mance of scheduled airlines indicates nei<strong>the</strong>r animprovement nor a decline, although fluctuations in <strong>the</strong> operating results occurred over <strong>the</strong> past ten years. During<strong>the</strong> 1983–1989 period, a decrease in fuel costs, along with o<strong>the</strong>r cost reduction and yield control measures,brought about an improvement in <strong>the</strong> financial results of <strong>the</strong> industry which generated a positive net result of4.4 per cent of operating revenues over this period. This trend was reversed in 1990 as a result of a steep increasein fuel prices caused by <strong>the</strong> Gulf crisis, along with a slowdown in <strong>the</strong> world economy. The market conditionschanged as <strong>the</strong> demand weakened and <strong>the</strong> utilization of airline resources tended <strong>to</strong> decline. The emergence ofexcess capacity and consequent competitive pressures put downward pressure on yields. These fac<strong>to</strong>rs combined<strong>to</strong> produce negative operating results in three consecutive years (1990–1992). In 1993, <strong>the</strong> airline industry started<strong>to</strong> move <strong>to</strong>wards a more appropriate balance of supply and demand and achieved a small operating surplus.Between 1994 and 2000, <strong>the</strong> airline industry continued <strong>to</strong> show positive operating results with profit marginsranging between 3.1 and 5.6 per cent of operating revenues. In 2001, shrinking operating revenues, due <strong>to</strong>declining traffic combined with increasing fuel, security and insurance costs, led <strong>to</strong> an unprecedented operationalloss of $11.8 billion and a net loss of $13 billion. In 2002, <strong>the</strong> operating loss is estimated at $4.9 billion and <strong>the</strong>net loss at $11.3 billion (see Table 4-1).3. As shown in Table 4-2, from 1992 <strong>to</strong> 2002 <strong>the</strong> <strong>to</strong>tal operating revenues of <strong>the</strong> world’s scheduled airlinesfrom scheduled and non-scheduled services (including incidental revenues) increased at an average annual rate of3.5 per cent, from $217 800 million <strong>to</strong> $306 000 million. During <strong>the</strong> same period, <strong>the</strong> corresponding <strong>to</strong>taloperating expenses increased at an average annual rate of 3.5 per cent, from $219 600 million <strong>to</strong> $310 900 million.During this period, <strong>the</strong> growth in world airline operating revenues was associated with an average annual growthin <strong>to</strong>tal traffic of 5.7 per cent in terms of TKPs (excluding domestic operations in <strong>the</strong> Russian Federation in 1992)and a decline in airline yields (average operating revenue per <strong>to</strong>nne-kilometre per<strong>for</strong>med) of 2.2 per cent perannum from 90.7 cents in 1992 <strong>to</strong> 72.9 cents in 2002. The unit cost per available <strong>to</strong>nne-kilometre (ATK) declinedby 1.2 per cent from 52.6 cents in 1992 <strong>to</strong> 45.2 cents in 2002. Figure 4-2 presents <strong>the</strong> trends in <strong>the</strong> financialper<strong>for</strong>mance indica<strong>to</strong>rs of <strong>the</strong> global airline industry in terms of unit revenues and costs as well as operating andnet results over <strong>the</strong> 1992–2002 period.24
Table 4-1. Operating revenues and expenses World (19702002)(Total services of scheduled airlines of ICAO Contracting States 1 )1970 1980 1990 1992 1993 1994 1995 1996 1997 1998 1999 2000 2001 2002(millions of dollars)OPERATING REVENUESScheduled services (<strong>to</strong>tal) 16 466 80 003 173 970 187 590 193 930 212 710 233 660 247 030 254 070 257 880 264 050 284 920 267 550 265 910Passenger 14 097 69 290 153 330 165 140 171 440 186 530 205 000 216 710 221 820 226 100 231 410 248 940 232 410 231 030Freight 1 745 9 293 18 410 20 110 20 270 23 890 25 980 27 830 29 720 29 420 30 400 33 840 32 990 32 740Mail 624 1 420 2 230 2 340 2 220 2 290 2 680 2 490 2 530 2 360 2 240 2 140 2 150 2 140Non-scheduled operations 805 3 260 7 090 7 870 8 230 9 110 10 680 11 740 11 250 9 660 11 440 11 710 10 470 9 790Incidental 546 4 413 18 440 22 340 23 840 22 880 22 660 23 730 25 680 27 960 30 010 31 870 29 480 30 300Total operating revenues 17 817 87 676 199 500 217 800 226 000 244 700 267 000 282 500 291 000 295 500 305 500 328 500 307 500 306 000OPERATING EXPENSESFlight operations (<strong>to</strong>tal) 4 651 33 768 56 320 57 360 59 270 61 350 66 550 74 810 76 390 75 080 82 240 98 790 97 020 95 700Flight crew salaries and expenses 1 796 6 424 13 780 15 790 16 520 17 860 19 450 21 020 21 550 22 330 24 280 26 380 27 840 27 960<strong>Air</strong>craft fuel and oil 1 944 24 524 30 300 26 800 26 840 26 900 28 970 34 600 34 580 29 180 32 190 45 900 42 950 40 400O<strong>the</strong>r (insurance, rental,training, etc.) 911 2 820 12 240 14 770 15 910 16 590 18 130 19 190 20 260 23 570 25 770 26 510 26 230 27 340Maintenance and overhaul 2 476 9 079 22 900 23 830 22 530 23 770 26 810 28 540 30 310 31 190 31 670 33 710 36 120 35 130Depreciation and amortization 1 899 5 457 13 850 15 380 15 580 17 990 18 400 19 100 17 990 18 280 19 280 20 780 22 670 22 190User charges and stationexpenses (<strong>to</strong>tal) 2 908 13 364 32 460 37 880 38 740 41 640 46 140 47 920 47 690 50 010 51 760 54 720 54 000 52 860Landing and associated airportcharges 530 3 069 7 730 8 460 9 260 10 480 11 440 11 600 11 210 12 400 12 780 13 490 12 660 12 440O<strong>the</strong>r 2 378 10 295 24 730 29 420 29 480 31 160 34 700 36 320 36 480 37 610 38 980 41 230 41 340 40 420Passenger services 1 714 7 963 20 710 23 630 23 580 25 610 28 070 29 090 29 310 29 770 31 520 31 780 32 670 31 710Ticketing, sales and promotion 2 643 12 634 32 860 36 050 36 590 37 360 39 590 41 320 40 700 40 110 40 130 40 450 35 650 33 260General, administrative ando<strong>the</strong>r operating expenses 1 076 6 055 21 900 25 470 27 410 29 280 27 940 29 420 32 310 35 160 36 600 37 570 41 170 40 050Total operating expenses 17 367 88 310 201 000 219 600 223 700 237 000 253 500 270 200 274 700 279 600 293 200 317 800 319 300 310 900Operating result [profit or loss (–)] 450 –634 –1 500 –1 800 2 300 7 700 13 500 12 300 16 300 15 900 12 300 10 700 –11 800 –4 900Operating result as a percentageof operating revenues 2.5 –0.7 –0.7 –0.8 1.0 3.1 5.1 4.4 5.6 5.4 4.0 3.3 –3.8 –1.6Net result –27 –919 –4 500 –7 900 –4 400 –200 4 500 5 300 8 550 8 200 8 500 3 700 –13 000 –11 300Net result as a percentageof operating revenues –0.2 –1.0 –2.3 –3.6 –1.9 –0.1 1.7 1.9 2.9 2.8 2.8 1.1 –4.2 –3.71. Excluding domestic operations of airlines registered in <strong>the</strong> USSR prior <strong>to</strong> 1992 and <strong>the</strong> Russian Federation from 1992–1996.Source: ICAOChapter 4. <strong>Air</strong>line Financial Trends 25
26 <strong>Outlook</strong> <strong>for</strong> <strong>Air</strong> <strong>Transport</strong> <strong>to</strong> <strong>the</strong> <strong>Year</strong> <strong>2015</strong>Table 4-2. Total and unit operating revenues and expenses World (1992 and 2002)(Total services of scheduled airlines of ICAO Contracting States)Operatingrevenues($ millions)Operatingexpenses($ millions)Totaltraffic(TKP millions)Unitrevenue(cents/TKP)Totalcapacity(ATK millions)Unitcost(cents/ATK)1992 1 217 800 219 600 240 100 90.7 417 840 52.62002 306 000 310 900 419 600 72.9 687 100 45.2Average annual growth2002/1992 (per cent)3.5 3.5 5.7 –2.2 5.1 –1.51. Excluding domestic operations of airlines registered in <strong>the</strong> Russian Federation.Source: ICAO Reporting Forms A-1 and EF-1.350 000RevenuesExpenses300 000250 000$ (millions)200 000150 000100 00050 00001992 93 94 95 96 97 98 99 2000 2001 2002Source: ICAO Reporting Form EF-1.Note: Excluding domestic operations of airlines registered in <strong>the</strong> Russian Federation prior <strong>to</strong> 1996.Figure 4-1. Scheduled airline operating revenues and expenses — World (1992–2002)
Chapter 4. <strong>Air</strong>line Financial Trends 2710080Revenue per TKPExpense per TKP60U.S. cents40Expense per ATK2001992 93 94 95 96 97 98 99 2000 2001 2002(Prel.)64Operating result as apercentage of revenues2Net result as apercentage of revenuesPer cent0-2-4-61992 93 94 95 96 97 98 99 2000 2001 2002Source: ICAO Reporting Form EF-1.Note: Excluding domestic operations of airlines registered in <strong>the</strong> Russian Federation prior <strong>to</strong> 1996.Figure 4-2. Financial per<strong>for</strong>mance indica<strong>to</strong>rs of scheduled airlines — World (1992–2002)
28 <strong>Outlook</strong> <strong>for</strong> <strong>Air</strong> <strong>Transport</strong> <strong>to</strong> <strong>the</strong> <strong>Year</strong> <strong>2015</strong>Yields and unit costs4. His<strong>to</strong>rically, airline fares have reflected <strong>the</strong> trends in operating costs and changing competitive conditions.<strong>Air</strong>line yields have declined in real terms almost every year since <strong>the</strong> advent of jet aircraft. The reductions in faresand freight rates, expressed in real terms, that occurred between 1960 and 2002 are reflected in real declines inpassenger revenue yield per passenger-kilometre and freight yield per freight <strong>to</strong>nne-kilometre. These declines inyield contributed substantially <strong>to</strong> traffic growth. Marketing of air transport was aided by <strong>the</strong> fact that air fares(average airline yields) represented a steadily improving bargain in comparison with many o<strong>the</strong>r services.Figure 4-3 illustrates <strong>the</strong> annual change in average passenger yield over <strong>the</strong> 1960–2002 period as well as <strong>the</strong>annual change in freight yield per <strong>to</strong>nne-kilometre. Average world passenger yield measured in real termsdecreased at a rate of 2.5 per cent per annum, while freight and mail yield decreased at a rate of 3.5 per cent perannum over that period. These declines in yield were <strong>the</strong> result of technological advances, longer average triplengths, greater competition and certain economies of scale.5. Measured in real terms, <strong>the</strong> operating costs per available <strong>to</strong>nne-kilometre (ATK) of world scheduledairlines declined on average by 3.6 per cent per annum over <strong>the</strong> 1992–2002 period, with year-<strong>to</strong>-year fluctuationsillustrated in Figure 4-4.6. <strong>Air</strong>line operating costs are heavily influenced by jet fuel prices. Due <strong>to</strong> large increases in oil prices in1979, unit costs rose sharply in 1980 with fuel costs accounting <strong>for</strong> almost 29 per cent of <strong>the</strong> <strong>to</strong>tal costs ofscheduled airlines. Unit costs declined during <strong>the</strong> period 1982–1985 partly as a result of declining fuel prices.Due <strong>to</strong> <strong>the</strong> hike in jet fuel prices, fuel costs accounted <strong>for</strong> over 14 per cent of <strong>to</strong>tal operating costs in 2000.Subsequently, <strong>the</strong> share declined as fuel prices decreased in 2001 and 2002 as illustrated in Figure 4-5. In 2003,however, that declining trend reversed due <strong>to</strong> sharp increases in fuel prices, and this trend is expected <strong>to</strong> continuein<strong>to</strong> 2004. The long-term outlook <strong>for</strong> fuel prices is not clear; prevailing industry expectations are <strong>for</strong> significantincreases in <strong>the</strong> short term and moderate increases at <strong>the</strong> rate of inflation in <strong>the</strong> long term. While this could have asignificant impact in <strong>the</strong> short term, in <strong>the</strong> long term it would have a relatively small impact on operating costs. Inaddition <strong>to</strong> aircraft fuel costs, o<strong>the</strong>r fac<strong>to</strong>rs that have an important impact on unit costs include aircraft utilizationand capacity as well as density of seating configuration.Operating revenues and expenses by category and region7. When comparing 1992 and 2002 as presented in Table 4-3, <strong>the</strong> share of revenues from scheduled servicesremained almost unchanged and accounted <strong>for</strong> nearly 87 per cent of <strong>to</strong>tal operating revenues in 2002. In terms ofrevenue components, passenger revenues of scheduled services declined slightly from 75.8 per cent in 1992 <strong>to</strong>75.5 per cent in 2002; in <strong>the</strong> same period, freight revenues increased from 9.2 per cent <strong>to</strong> 10.7 per cent, while mailrevenues declined from 1.1 per cent <strong>to</strong> 0.7 per cent. Non-scheduled revenues declined marginally from 3.6 percent in 1992 <strong>to</strong> 3.2 per cent in 2002 and incidental revenues (which cover sales of services and maintenance,leasing of aircraft <strong>to</strong> o<strong>the</strong>r airlines and o<strong>the</strong>r non-core transport-related activities) decreased slightly.8. Considering <strong>the</strong> two major categories of airline operating expenses, direct expenses accounted <strong>for</strong> abouthalf of <strong>the</strong> <strong>to</strong>tal in 2002 while indirect expenses made up <strong>the</strong> o<strong>the</strong>r half, compared <strong>to</strong> 44.0 and 56.0 per cent,respectively, in 1992. The major part of <strong>the</strong> direct expenses, i.e. <strong>to</strong>tal flight operations expenses, increased byalmost 5 percentage points between 1992 and 2002, mainly because of significant increases in “flight crew” and“o<strong>the</strong>r” expenses. Among <strong>the</strong> indirect expenses, “general, administrative and o<strong>the</strong>r operating expenses” rose by1.3 percentage points, while “ticketing, sales and promotion” fell by 5.7 percentage points during <strong>the</strong> same period(see Chapter 2, para. 52 regarding cost savings on this item).9. Estimates of <strong>the</strong> distribution of <strong>to</strong>tal operating revenues and expenses according <strong>to</strong> <strong>the</strong> region of airlineregistration are given <strong>to</strong>ge<strong>the</strong>r with <strong>the</strong> corresponding operating results in Table 4-4 <strong>for</strong> 1992 and 2002. In 2002,about 36 per cent of operating revenues and 38 per cent of operating expenses of <strong>the</strong> world’s airlines wereattributable <strong>to</strong> North American airlines, some 31 per cent of revenues and 30 per cent of expenses <strong>to</strong> European
Chapter 4. <strong>Air</strong>line Financial Trends 29(Prel.)Source: ICAO Reporting Form EF-1.Note: Excluding domestic operations of airlines registered in <strong>the</strong> USSR prior <strong>to</strong> 1992 and<strong>the</strong> Russian Federation from 1992-1996.Figure 4-3. Passenger and freight yields of scheduled airlines — World (1960–2002)(U.S. cents in real terms)Figure 4-4. Unit operating costs of scheduled airlines — World (1992–2002)(U.S. cents per ATK in real terms)
30 <strong>Outlook</strong> <strong>for</strong> <strong>Air</strong> <strong>Transport</strong> <strong>to</strong> <strong>the</strong> <strong>Year</strong> <strong>2015</strong>airlines and some 24 per cent of revenues and 22 per cent of expenses <strong>to</strong> airlines of Asia/Pacific, with <strong>the</strong>remaining 9 per cent and 10 per cent of revenues and expenses, respectively, divided among those of Africa, <strong>the</strong>Middle East and Latin America/Caribbean. Compared <strong>to</strong> 1992, <strong>the</strong> 2002 shares of operating revenues andexpenses of <strong>the</strong> airlines of Asia/Pacific represented a gain of some 2 percentage points of <strong>the</strong> world <strong>to</strong>tal, whilethose of <strong>the</strong> North American carriers declined by about 1 percentage point in revenues and remained almostunchanged in expenses. The shares of <strong>the</strong> airlines of <strong>the</strong> remaining regions declined marginally.OUTLOOK10. Over <strong>the</strong> <strong>for</strong>ecast period 2002–<strong>2015</strong>, <strong>the</strong> airline industry is likely <strong>to</strong> face substantial inflationary pressureon operating costs, particularly in <strong>the</strong> areas of labour and capital. The prospects <strong>for</strong> airline yields are closelyrelated <strong>to</strong> cost developments and market conditions in <strong>the</strong> airline industry. Cost items under particular scrutiny atpresent are fuel and oil; labour; ticketing, sales and promotion (notably in connection with product distribution);and general/administrative expenses. Productivity improvements in <strong>the</strong> airline industry should continue <strong>to</strong>produce some cost savings. However, <strong>the</strong> magnitude of improvements in cost efficiency resulting from fleetdevelopments is likely <strong>to</strong> be significantly less than in <strong>the</strong> past due <strong>to</strong> <strong>the</strong> high capital cost of new aircraft and <strong>the</strong>increase in <strong>the</strong> cost of financing.Figure 4-5. Share of fuel and oil in operating expenses ofscheduled airlines — World (1992–2002)
Chapter 4. <strong>Air</strong>line Financial Trends 3111. Over this <strong>for</strong>ecast period average passenger yields (fares) in real terms are expected <strong>to</strong> decline at anannual rate of 0.5 per cent <strong>for</strong> <strong>the</strong> period 2002 <strong>to</strong> 2006 and <strong>to</strong> stabilize <strong>for</strong> <strong>the</strong> remaining nine years. Averagefreight yields (rates) in real terms are expected <strong>to</strong> decline at a 0.5 per cent rate from 2002 <strong>to</strong> 2008 and <strong>to</strong> stabilize<strong>for</strong> <strong>the</strong> remaining period through <strong>to</strong> <strong>2015</strong>.Table 4-3. Distribution of operating revenues and expenses World (1992 and 2002)(Total services of scheduled airlines of ICAO Contracting States)Distribution by category(per cent)Change in per centshare of item1992 1 2002 1992 <strong>to</strong> 2002OPERATING REVENUESScheduled services (<strong>to</strong>tal) 86.1 86.9 0.8Passenger 75.8 75.5 0.3Freight 9.2 10.7 1.5Mail 1.1 0.7 0.4Non-scheduled operations 3.6 3.2 0.4Incidental 10.3 9.9 0.4TOTAL 100.0 100.0 —OPERATING EXPENSESDirect aircraftFlight operations (<strong>to</strong>tal) 26.1 30.7 4.6Flight crew 7.2 9.0 1.8Fuel and oil 12.2 13.0 0.8O<strong>the</strong>r 6.7 8.7 2.0Maintenance and overhaul 10.9 11.3 0.4Depreciation and amortization 7.0 7.1 0.1Sub-<strong>to</strong>tal 44.0 49.1 5.1IndirectUser charges and station expenses (<strong>to</strong>tal) 17.2 17.0 0.2Landing and associated airport charges 3.9 4.0 0.1O<strong>the</strong>r 13.3 13.0 0.3Passenger services 10.8 10.3 0.5Ticketing, sales, promotion 16.4 10.7 5.7General, administrative and o<strong>the</strong>r 11.6 12.9 1.3Sub-<strong>to</strong>tal 56.0 50.9 5.1TOTAL 100.0 100.0 —1. Excluding domestic operations of airlines registered in <strong>the</strong> Russian Federation.Source: ICAO <strong>Air</strong> <strong>Transport</strong> Reporting Forms A-1 and EF.
32 <strong>Outlook</strong> <strong>for</strong> <strong>Air</strong> <strong>Transport</strong> <strong>to</strong> <strong>the</strong> <strong>Year</strong> <strong>2015</strong>Table 4-4. Distribution of operating revenues and expenses Regions of airline registration (1992 1 and 2002)(Total services of scheduled airlines of ICAO Contracting States)<strong>Year</strong>Operating revenues Operating expenses Operating resultDollars(millions)Per cen<strong>to</strong>f worldDollars(millions)Per cen<strong>to</strong>f worldDollars(millions)Per cent ofoperatingrevenuesAfrica 1992 5 700 2.6 5 350 2.4 350 6.12002 6 900 2.3 6 700 2.2 200 2.9Asia and Pacific 1992 47 200 21.7 45 650 20.8 1 550 3.32002 72 600 23.7 69 700 22.4 2 900 4.0Europe 1992 67 750 31.1 68 000 31.0 250 0.42002 94 600 30.9 92 800 29.8 1 800 1.9Middle East 1992 6 850 3.2 6 650 3.0 200 2.92002 9 400 3.1 9 500 3.1 200 2.1North America 1992 80 200 36.8 83 150 37.9 2 950 3.72002 109 700 35.8 118 600 38.1 8 900 8.1Latin America and Caribbean 1992 10 100 4.6 10 800 4.9 700 6.92002 12 800 4.2 13 500 4.3 700 5.4World 1992 217 800 100.0 219 600 100.0 1 800 0.82002 306 000 100.0 310 900 100.0 4 900 1.61. Excluding domestic operations of airlines registered in <strong>the</strong> Russian Federation.Source: ICAO Digests of Statistics, Series F Financial Data.___________________
Chapter 5FORECASTS OF AIRLINE TRAFFICTO THE YEAR <strong>2015</strong>FORECASTING METHODOLOGY1. As a basis <strong>for</strong> <strong>the</strong> preparation of <strong>the</strong> traffic <strong>for</strong>ecasts <strong>for</strong> this study, econometric analyses were carried ou<strong>to</strong>f <strong>the</strong> effects of underlying fac<strong>to</strong>rs on <strong>the</strong> his<strong>to</strong>ric aggregate demands <strong>for</strong> scheduled passenger and freight traffic.These analyses were used <strong>to</strong> translate expectations of future world economic development and future trends ininternational trade and average fares in<strong>to</strong> projections of future traffic demand.2. More detailed projections <strong>for</strong> international and domestic scheduled traffic <strong>for</strong> <strong>the</strong> airlines of eachgeographical region were initially developed from <strong>the</strong> <strong>for</strong>ecasts of <strong>to</strong>tal scheduled traffic by analysing his<strong>to</strong>rictraffic trends and market shares <strong>for</strong> <strong>the</strong> airlines, based on <strong>the</strong> individual geographical regions. These projectionswere reviewed in light of economic trends and o<strong>the</strong>r fac<strong>to</strong>rs relevant <strong>to</strong> particular regions. As mentioned inChapter 2, <strong>the</strong> events of 11 September 2001 adversely affected <strong>the</strong> growth of traffic during <strong>the</strong> subsequent years.These effects were amplified by <strong>the</strong> war in Iraq and <strong>the</strong> outbreak of SARS. These traffic trends were taken in<strong>to</strong>consideration while postulating future traffic projections.3. The procedures described above relate <strong>to</strong> traffic <strong>for</strong>ecasts in terms of passenger-kilometres per<strong>for</strong>med andfreight <strong>to</strong>nne-kilometres per<strong>for</strong>med. In addition, <strong>for</strong>ecasts of <strong>the</strong> number of passengers carried and freight <strong>to</strong>nnescarried were prepared <strong>for</strong> <strong>to</strong>tal scheduled international and domestic services. These were derived from <strong>the</strong><strong>for</strong>ecasts of passenger-kilometres and <strong>to</strong>nne-kilometres on <strong>the</strong> basis of expectations of future trends in <strong>the</strong> averagelength of haul <strong>for</strong> <strong>the</strong> various types of services.4. Forecasts of passengers carried by scheduled airline services on selected intercontinental route groupswere also developed. For a particular group of routes, <strong>the</strong> traffic <strong>for</strong>ecasts <strong>to</strong>ok in<strong>to</strong> account economicdevelopments in <strong>the</strong> regions at ei<strong>the</strong>r end of <strong>the</strong> route and average airline yield on <strong>the</strong> route concerned, as well aso<strong>the</strong>r fac<strong>to</strong>rs pertinent <strong>to</strong> <strong>the</strong> particular route group. Econometric analyses were used in <strong>the</strong> <strong>for</strong>ecasting processwherever possible.MAIN ASSUMPTIONS ANDECONOMETRIC MODELS5. The following are <strong>the</strong> main assumptions concerning trends, over <strong>the</strong> period 2002 <strong>to</strong> <strong>2015</strong>, in <strong>the</strong> fac<strong>to</strong>rsthat underlie traffic growth:a) a “most likely” average rate of world economic growth of 2.5 per cent per annum (in real terms);b) moderate growth in world trade at a “most likely” average rate of about 3 per cent per annum;c) a 0.5 per cent per annum decline in average passenger yields (fares) in real terms <strong>for</strong> <strong>the</strong> period2002 <strong>to</strong> 2006, and no change in average yield (in real terms) <strong>for</strong> <strong>the</strong> remaining years <strong>for</strong> <strong>the</strong> world33
34 <strong>Outlook</strong> <strong>for</strong> <strong>Air</strong> <strong>Transport</strong> <strong>to</strong> <strong>the</strong> <strong>Year</strong> <strong>2015</strong>as a whole, whereas <strong>for</strong> <strong>the</strong> freight yields (rates) in real terms, a 0.5 per cent decline <strong>for</strong> <strong>the</strong> period2002 <strong>to</strong> 2008, and <strong>the</strong>reafter no change <strong>for</strong> <strong>the</strong> remaining period; andd) availability of adequate capital resources <strong>for</strong> <strong>the</strong> development of aviation and <strong>to</strong>urist infrastructure.6. On <strong>the</strong> basis of his<strong>to</strong>rical data, several econometric models were developed <strong>for</strong> scheduled passengertravel demand, <strong>for</strong> freight traffic demand and <strong>for</strong> geographical regions, as well as <strong>for</strong> various route groupswherever possible.7. The econometric models developed <strong>for</strong> predicting demand in terms of <strong>to</strong>tal world scheduledpassenger-kilometres per<strong>for</strong>med (PKPs) and <strong>to</strong>tal world freight <strong>to</strong>nne-kilometres (FTKs) are described inAppendix 1. The first model provided estimates of <strong>the</strong> effect on scheduled passenger travel of changes in worldGDP and average passenger fare levels (both in real terms), and <strong>the</strong> second provided estimates of <strong>the</strong> effect onscheduled freight transport of changes in world exports and average freight rate levels (in real terms).GLOBAL PASSENGER FORECASTS8. Inserting <strong>the</strong> above economic and yield assumptions in<strong>to</strong> <strong>the</strong>se models resulted in growth rates <strong>for</strong> <strong>the</strong>period 2002–<strong>2015</strong> <strong>for</strong> world scheduled traffic of 4.4 per cent per annum <strong>for</strong> passenger-kilometres. In view of <strong>the</strong>recent traffic trends and expectations of future developments of <strong>the</strong> underlying fac<strong>to</strong>rs, this growth rate has beendeemed as a fair representation of future traffic growth up <strong>to</strong> <strong>2015</strong>, barring any un<strong>for</strong>eseen events of significance.9. As in <strong>the</strong> past, year-<strong>to</strong>-year growth is likely <strong>to</strong> fluctuate considerably. As an indication of <strong>the</strong> sensitivityof traffic growth <strong>to</strong> alternative assumptions about economic growth and trends in passenger yields, a “low”passenger traffic <strong>for</strong>ecast of 3.1 per cent per annum results from assumptions of 2.0 per cent per annum averagegrowth of GDP in real terms and an increase in real fares (yield) of 1.0 per cent per annum during <strong>the</strong> <strong>for</strong>ecasthorizon. A “high” <strong>for</strong>ecast of 5.6 per cent per annum results from assumptions of 3.0 per cent per annum <strong>for</strong>economic growth and an average annual decline in real fares of 1.0 per cent. The “most likely”, “low” and“high” trends are illustrated in Figure 5-1.10. International scheduled passenger traffic (in PKPs) is <strong>for</strong>ecast <strong>to</strong> grow at an average rate of 5.1 per centper annum compared with 3.1 per cent per annum <strong>for</strong> domestic scheduled passenger traffic, as shown in Table 5-1and also illustrated in Figure 5-1. The slower growth of domestic traffic results from <strong>the</strong> fact that nearly 63 percent of all domestic scheduled traffic is accounted <strong>for</strong> by <strong>the</strong> already highly developed domestic system in <strong>the</strong>United States where growth rates are expected <strong>to</strong> be moderate.11. Forecasts of scheduled passenger traffic in terms of <strong>the</strong> number of passengers carried are also given inTable 5-1. Growth in terms of world scheduled passengers carried is expected <strong>to</strong> be somewhat lower than growthin passenger-kilometres because <strong>the</strong> latter includes <strong>the</strong> effect of an anticipated increase in <strong>the</strong> average passengerjourney distance at an annual rate of about 1 per cent. The number of passengers carried is projected <strong>to</strong> reachsome 2.5 billion worldwide by <strong>2015</strong>.12. The increase in <strong>the</strong> average passenger journey distance <strong>for</strong> international traffic had been pronounced in<strong>the</strong> past, but it has declined somewhat during <strong>the</strong> 1992–2002 period. Due <strong>to</strong> this decline, <strong>the</strong> growth of passengerscarried on international services slightly exceeded <strong>the</strong> growth of passenger-kilometres during <strong>the</strong> same period. Itis expected that <strong>the</strong> growth in average passenger journey would remain almost unchanged during <strong>the</strong> <strong>for</strong>ecastperiod, and <strong>the</strong> number of passengers carried on scheduled international services will reach over 1 billion by <strong>the</strong>year <strong>2015</strong>.13. Putting <strong>the</strong> expected growth in passenger traffic in perspective, <strong>the</strong> passenger-kilometres per<strong>for</strong>med andpassengers carried are expected <strong>to</strong> increase by about 74 per cent and 56 per cent, respectively, between 2002
Chapter 5. Forecasts of <strong>Air</strong>line Traffic <strong>to</strong> <strong>the</strong> <strong>Year</strong> <strong>2015</strong> 35Table 5-1. ICAO scheduled passenger traffic <strong>for</strong>ecasts World (1992–<strong>2015</strong>)(ICAO Contracting States)Average annual growth rateActual Actual Forecast(per cent)1992 2002 <strong>2015</strong> 1992–2002 2002–<strong>2015</strong>Passenger-kilometres (billions)Scheduled services 1 929 2 942 5 120 4.3 4.4International 982 1 732 3 310 5.8 5.1Domestic 947 1 210 1 810 2.5 3.1Passengers carried (millions)Scheduled services 1 146 1 615 2 520 3.5 3.5International 299 544 1 030 6.2 5.0Domestic 847 1 071 1 490 2.4 2.67 0006 000Passenger-kilometres (billions)5 0004 0003 0002 000TotalHigh (5.6% p.a.)Most likely 4.4% p.a.Low (3.1% p.a.)Most likely1 000InternationalDomesticMost likelyACTUALFORECAST01992 94 96 98 2000 2002 2010 <strong>2015</strong>Figure 5-1. Trends in scheduled passenger traffic — World (1992–<strong>2015</strong>)(ICAO Contracting States)
36 <strong>Outlook</strong> <strong>for</strong> <strong>Air</strong> <strong>Transport</strong> <strong>to</strong> <strong>the</strong> <strong>Year</strong> <strong>2015</strong>and <strong>2015</strong>. In absolute terms, <strong>the</strong> increase in passenger-kilometres during <strong>the</strong> <strong>for</strong>ecast period is expected <strong>to</strong> besome 2 180 billion, which is more than twice <strong>the</strong> 1 013 billion increase during <strong>the</strong> period 1992–2002. Theabsolute increase in passengers carried is projected <strong>to</strong> be slightly above 900 million by <strong>2015</strong>, compared with469 million between 1992 and 2002.REGIONAL PASSENGER FORECASTS14. The “most likely” <strong>for</strong>ecasts of scheduled airline passenger traffic by region of airline registration aregiven in Table 5-2, <strong>to</strong>ge<strong>the</strong>r with his<strong>to</strong>rical figures <strong>for</strong> 1992 and 2002. The airlines of <strong>the</strong> Middle East andAsia/Pacific regions are expected <strong>to</strong> show <strong>the</strong> highest growth in passenger traffic, at 6.4 per cent and 6.1 per centper annum respectively, through <strong>to</strong> <strong>the</strong> year <strong>2015</strong>, while <strong>the</strong> airlines of North America are anticipated <strong>to</strong> show <strong>the</strong>lowest growth, around 2.8 per cent per annum. Traffic of <strong>the</strong> airlines of <strong>the</strong> African and <strong>the</strong> LatinAmerica/Caribbean regions are expected <strong>to</strong> grow at about 4 per cent per annum, whereas traffic of Europeanairlines is <strong>for</strong>ecast <strong>to</strong> grow at 4.1 per cent, slightly below <strong>the</strong> world average.15. As a result of <strong>the</strong> projected growth in passenger traffic, <strong>the</strong> airlines of <strong>the</strong> Asia/Pacific region areexpected <strong>to</strong> increase <strong>the</strong>ir share of world passenger traffic (in terms of passenger-kilometres) by about6.5 percentage points <strong>to</strong> 33.2 per cent, with <strong>the</strong>ir share of <strong>to</strong>tal international scheduled passenger traffic increasing<strong>to</strong> about 37 per cent, both traffic shares being <strong>the</strong> highest among all <strong>the</strong> regions.16. A significant change in regional share is expected <strong>to</strong> occur in North America, whose airlines’ share isanticipated <strong>to</strong> decline by about 6.5 percentage points <strong>to</strong> 30.3 per cent by <strong>the</strong> year <strong>2015</strong>. The shares of internationaland domestic scheduled traffic of North America are expected <strong>to</strong> decrease, but <strong>the</strong> region will still hold <strong>the</strong>highest share of world domestic traffic at 58.6 per cent. The shares of airlines of o<strong>the</strong>r regions are anticipated <strong>to</strong>remain almost unchanged.PASSENGER FORECASTS FORINTERCONTINENTAL ROUTE GROUPS17. The <strong>for</strong>ecasts of <strong>the</strong> number of passengers carried on scheduled services in nine intercontinental routegroups, accounting <strong>for</strong> almost 38 per cent of international passengers in 2002, are presented in Table 5-3. For <strong>the</strong>majority of <strong>the</strong>se route groups, growth rates <strong>for</strong> <strong>the</strong> 2002–<strong>2015</strong> period are <strong>for</strong>ecast <strong>to</strong> be slightly lower than during<strong>the</strong> 1992–2002 period. Traffic across <strong>the</strong> North Atlantic suffered a major setback due <strong>to</strong> <strong>the</strong> events of11 September 2001 and has since been declining; however, it is expected <strong>to</strong> recover and grow at <strong>the</strong> worldaverage. The Transpacific route group is expected <strong>to</strong> grow fastest among <strong>the</strong> nine route groups at an averageannual rate of 6.6 per cent.18. Since 2001, <strong>the</strong> route groups <strong>to</strong>/from Europe have experienced a slowdown in <strong>the</strong>ir growth rates but areanticipated <strong>to</strong> increase at about <strong>the</strong> same rate as in <strong>the</strong> past decade, except <strong>for</strong> <strong>the</strong> Europe-Asia/Pacific marketwhich is expected <strong>to</strong> grow at about 2 percentage points lower than in <strong>the</strong> past decade, thus achieving <strong>the</strong> sameaverage as <strong>the</strong> world during <strong>the</strong> <strong>for</strong>ecast period.19. The remaining route groups shown in Table 5-3 are smaller in terms of passenger numbers. Their growthrates up <strong>to</strong> <strong>the</strong> year <strong>2015</strong> are projected <strong>to</strong> range from a high of 4.9 per cent <strong>for</strong> <strong>the</strong> Mid-Atlantic <strong>to</strong> a low of 4.5 percent <strong>for</strong> <strong>the</strong> South Atlantic and <strong>the</strong> North America-South America route groups. The growth in air travel demandin most of <strong>the</strong>se markets is supported by competitive services and by growth in leisure travel.
Chapter 5. Forecasts of <strong>Air</strong>line Traffic <strong>to</strong> <strong>the</strong> <strong>Year</strong> <strong>2015</strong> 37Table 5-2. ICAO scheduled passenger traffic Regions of airline registration (1992–<strong>2015</strong>)(ICAO Contracting States)Passenger-kilometres(billions)Average annual growthrate (per cent)Regional share of worldtraffic (per cent)Actual1992Actual2002Forecast<strong>2015</strong> 1992–2002 2002–<strong>2015</strong> 1992 2002 <strong>2015</strong>AfricaTotal 42.9 66.2 110 4.4 4.0 2.2 2.2 2.1International 34.9 57.5 100 5.1 4.3 3.6 3.3 3.0Domestic 8.0 8.7 10 0.8 1.1 0.8 0.7 0.6Asia/PacificTotal 409.2 785.1 1 700 6.7 6.1 21.2 26.7 33.2International 276.9 537.6 1 220 6.9 6.5 28.2 31.0 36.9Domestic 132.3 247.5 480 6.5 5.2 14.0 20.5 26.5EuropeTotal 525.7 769.7 1 300 3.9 4.1 27.3 26.2 25.4International 330.8 643.8 1 150 6.9 4.6 33.7 37.2 34.7Domestic 194.9 125.9 150 4.3 1.4 20.6 10.4 8.3Middle EastTotal 53.4 106.7 240 7.2 6.4 2.8 3.6 4.7International 44.5 93.5 220 7.7 6.8 4.5 5.4 6.6Domestic 8.9 13.2 20 4.0 3.2 0.9 1.1 1.1North AmericaTotal 806.4 1 082.3 1 550 3.0 2.8 41.8 36.8 30.3International 238.8 322.4 490 3.0 3.3 24.3 18.6 14.8Domestic 567.6 759.9 1 060 3.0 2.6 60.0 62.8 58.6Latin America/CaribbeanTotal 90.9 132.3 220 3.8 4.0 4.7 4.5 4.3International 56.4 77.4 130 3.2 4.1 5.7 4.5 3.9Domestic 34.5 54.9 90 4.8 3.9 3.6 4.5 5.0WorldTotal 1 928.5 2 942.3 5 120 4.3 4.4 100.0 100.0 100.0International 982.3 1 732.2 3 310 5.8 5.1 100.0 100.0 100.0Domestic 946.2 1 210.1 1 810 2.5 3.1 100.0 100.0 100.0GLOBAL FREIGHT FORECASTS20. The econometric analysis, <strong>to</strong>ge<strong>the</strong>r with <strong>the</strong> assumptions mentioned earlier, resulted in a “most likely”projected growth rate of 5.5 per cent per annum <strong>for</strong> world scheduled freight <strong>to</strong>nne-kilometres <strong>for</strong> <strong>the</strong> period 2002–<strong>2015</strong>. This is about one percentage point lower than <strong>the</strong> 6.4 per cent per annum <strong>for</strong> <strong>the</strong> 1992–2002 period.Alternative assumptions concerning <strong>the</strong> underlying fac<strong>to</strong>rs affecting air freight suggest a band of <strong>for</strong>ecast growthrates ranging from a “low” of 3.5 per cent per annum <strong>to</strong> a “high” of 7.3 per cent per annum as illustrated inFigure 5-2.
38 <strong>Outlook</strong> <strong>for</strong> <strong>Air</strong> <strong>Transport</strong> <strong>to</strong> <strong>the</strong> <strong>Year</strong> <strong>2015</strong>Table 5-3. ICAO scheduled passenger traffic Intercontinental route groups (1992–<strong>2015</strong>)Actual1992Passengers carried(thousands)Actual2002Average annual growthrate (per cent)Forecast<strong>2015</strong> 1992–2002 2002–<strong>2015</strong>North Atlantic 40 900 64 900 123 600 4.7 5.1Mid-Atlantic 2 300 3 900 7 300 5.4 4.9South Atlantic 2 760 4 370 7 750 4.7 4.5Transpacific 18 121 24 279 55 916 3.0 6.6Between Europe and Asia/Pacific 15 000 30 000 57 300 7.2 5.1Between Europe and Africa 13 200 21 645 43 410 5.1 5.5Between Europe and Middle East 8 100 13 100 24 700 4.9 5.0Between North America andSouth AmericaBetween North America and CentralAmerica/Caribbean5 250 8 740 15 500 5.2 4.522 000 35 800 65 000 5.0 4.7Total above routes 127 631 206 734 400 476 4.9 5.2O<strong>the</strong>r routes 171 836 337 876 629 524 7.0 4.9Total world 299 467 544 610 1 030 000 6.2 5.0Note: The his<strong>to</strong>rical database has been developed from several sources, including ICAO, ICAO traffic <strong>for</strong>ecasting groups,IATA and aircraft manufacturers.21. Table 5-4 presents <strong>the</strong> ICAO <strong>for</strong>ecasts of scheduled freight traffic (including international and domesticcomponents) in terms of both <strong>to</strong>nne-kilometres per<strong>for</strong>med and <strong>to</strong>nnes carried. International freight traffic isexpected <strong>to</strong> grow more rapidly than domestic freight traffic, due partly <strong>to</strong> <strong>the</strong> relatively fast growth ofinternational commerce. Domestic freight is dominated by <strong>the</strong> more mature market of <strong>the</strong> United States, and thisis ano<strong>the</strong>r reason <strong>for</strong> <strong>the</strong> moderate growth of <strong>to</strong>tal domestic traffic. Freight <strong>to</strong>nnes carried are expected <strong>to</strong> growmore slowly than freight <strong>to</strong>nne-kilometres because of a continuing increase in <strong>the</strong> average length of haul.REGIONAL FREIGHT FORECASTS22. The “most likely” <strong>for</strong>ecasts of scheduled freight traffic by region of airline registration are presented inTable 5-5. The regional pattern of growth is ra<strong>the</strong>r similar <strong>to</strong> that <strong>for</strong> passenger traffic. Asia/Pacific and <strong>the</strong>Middle East are expected <strong>to</strong> remain <strong>the</strong> fastest growing regions, although <strong>the</strong>ir <strong>for</strong>ecast growth rates aresomewhat lower than <strong>the</strong> growth rates achieved during <strong>the</strong> 1992–2002 period.23. By <strong>the</strong> year <strong>2015</strong>, airlines of <strong>the</strong> Asia/Pacific region are expected <strong>to</strong> increase <strong>the</strong>ir share of air freighttraffic by 4.4 percentage points <strong>to</strong> slightly over 40 per cent of <strong>to</strong>tal world freight, a share well above that of anyo<strong>the</strong>r region.
Chapter 5. Forecasts of <strong>Air</strong>line Traffic <strong>to</strong> <strong>the</strong> <strong>Year</strong> <strong>2015</strong> 39300ACTUALFORECASTFreight <strong>to</strong>nne-kilometres (billions)22515075TotalInternationalMost likelyHigh (7.3% p.a.)Most likely 5.5% p.a.Low (3.5% p.a.)DomesticMost likely01992 94 96 98 2000 2002 2010 <strong>2015</strong>Figure 5-2. Trends in scheduled freight traffic — World (1992–<strong>2015</strong>)(ICAO Contracting States)Table 5-4. ICAO scheduled freight traffic <strong>for</strong>ecasts World (1992–<strong>2015</strong>)(ICAO Contracting States)Average annual growth rate(per cent)Actual Actual Forecast1992 2002 <strong>2015</strong> 1992–2002 2002–<strong>2015</strong>Freight <strong>to</strong>nne-kilometres (millions)Total 62 675 116 628 233 850 6.4 5.5International 50 753 100 588 209 600 7.1 5.8Domestic 11 922 16 040 24 250 3.5 3.2Freight <strong>to</strong>nnes carried (thousands)Total 17 647 29 538 51 700 5.3 4.4International 9 313 19 013 37 200 7.4 5.3Domestic 8 334 10 525 14 500 2.4 2.5
40 <strong>Outlook</strong> <strong>for</strong> <strong>Air</strong> <strong>Transport</strong> <strong>to</strong> <strong>the</strong> <strong>Year</strong> <strong>2015</strong>Table 5-5. ICAO scheduled freight traffic Regions of airline registration (1992–<strong>2015</strong>)(ICAO Contracting States)Actual1992Freight <strong>to</strong>nne-kilometres(millions)Actual2002Forecast<strong>2015</strong>Average annualgrowth rate(per cent)1992–2002Regional share of worldtraffic (per cent)2002–<strong>2015</strong> 1992 2002 <strong>2015</strong>AfricaTotal 1 238 1 856 3 100 4.1 4.0 2.0 1.6 1.3International 1 135 1 777 3 000 4.6 4.1 2.2 1.8 1.4Domestic 103 79 100 2.6 1.8 0.9 0.5 0.4Asia/PacificTotal 19 410 42 063 94 600 8.0 6.4 31.0 36.1 40.5International 17 752 38 196 86 500 8.0 6.5 35.0 38.0 41.3Domestic 1 658 3 867 8 100 8.8 5.9 13.9 24.1 33.4EuropeTotal 19 460 32 828 61 000 5.4 4.9 31.0 28.1 26.1International 17 680 32 019 60 000 6.1 4.9 34.8 31.8 28.6Domestic 1 780 809 1 000 7.6 1.6 14.9 5.0 4.1Middle EastTotal 2 625 5 355 12 250 7.4 6.6 4.2 4.6 5.2International 2 552 5 251 12 100 7.5 6.6 5.0 5.2 5.8Domestic 73 104 150 3.6 2.9 0.6 0.6 0.6North AmericaTotal 16 867 30 586 57 500 6.1 5.0 26.9 26.2 24.6International 9 114 20 264 44 000 8.3 6.1 18.0 20.1 21.0Domestic 7 753 10 322 13 500 2.9 2.1 65.0 64.3 55.7Latin America/CaribbeanTotal 3 075 3 940 5 400 2.5 2.5 4.9 3.4 2.3International 2 520 3 079 4 000 2.0 2.0 5.0 3.1 1.9Domestic 555 861 1 400 4.5 3.8 4.7 5.4 5.8WorldTotal 62 675 116 628 233 850 6.4 5.5 100.0 100.0 100.0International 50 753 100 586 209 600 7.1 5.8 100.0 100.0 100.0Domestic 11 922 16 042 24 250 3.0 3.2 100.0 100.0 100.0
Chapter 5. Forecasts of <strong>Air</strong>line Traffic <strong>to</strong> <strong>the</strong> <strong>Year</strong> <strong>2015</strong> 41SUMMARY OF AIR TRAFFIC FORECASTSBY OTHER ORGANIZATIONS24. Some recent long-term <strong>for</strong>ecasts by major airframe and engine manufacturers of growth in worldscheduled traffic are given in Table 5-6. These <strong>for</strong>ecast growth rates are in <strong>the</strong> range of 4.7 <strong>to</strong> 5.1 per cent perannum <strong>for</strong> passenger-kilometres, with freight <strong>to</strong>nne-kilometres generally <strong>for</strong>ecast <strong>to</strong> grow at a slightly higher rate<strong>for</strong> <strong>the</strong> period ranging from 2001 <strong>to</strong> 2022.25. Separate <strong>for</strong>ecasts (medium-term only) <strong>for</strong> <strong>the</strong> number of passengers carried and passenger-kilometresper<strong>for</strong>med on world international services by member airlines, are regularly prepared by <strong>the</strong> International <strong>Air</strong><strong>Transport</strong> Association (IATA). The most recent <strong>for</strong>ecasts, covering <strong>the</strong> 2003–2007 period, indicate an averagegrowth of 4.7 per cent per annum <strong>for</strong> both passengers and passenger-kilometres per<strong>for</strong>med.Table 5-6.Global scheduled traffic <strong>for</strong>ecasts by aerospace manufacturersAverage annual growth rate(per cent)ForecastperiodPassengerkilometresFreight <strong>to</strong>nnekilometres<strong>Air</strong>bus Industrie 2001–2020 4.7 5.5Boeing 2003–2022 5.1 —Rolls-Royce 2002–2022 4.9 —Source: <strong>Air</strong>bus Industrie, Global Market Forecast, 2002;Boeing Commercial <strong>Air</strong>planes, Current Market <strong>Outlook</strong>, 2003;Rolls-Royce, The <strong>Outlook</strong>, 2003.___________________
Chapter 6FORECASTS OF AIRCRAFT MOVEMENTSTO THE YEAR <strong>2015</strong>FACTORS AFFECTING AIRCRAFT MOVEMENTS1. The planning of aviation facilities and <strong>the</strong> development of aviation policies require assessment of futuretrends in aircraft movements as well as of passenger and freight traffic flows. This is becoming increasinglyimportant because of concerns over airport and airspace congestion in some regions. <strong>Air</strong>craft movements havegrown steadily during most of <strong>the</strong> past decade, increasing <strong>the</strong> pressure on airport and air navigation services.Traffic declines since 2001 have somewhat eased this pressure in <strong>the</strong> regions concerned, but as traffic recovers,airport and airspace congestion are expected <strong>to</strong> build up again.2. The primary fac<strong>to</strong>r affecting <strong>the</strong> number of aircraft movements is <strong>the</strong> demand <strong>for</strong> passenger travel. Thepassenger traffic <strong>for</strong>ecasts presented in <strong>the</strong> previous chapter are, <strong>the</strong>re<strong>for</strong>e, key inputs <strong>to</strong> <strong>the</strong> aircraft movement<strong>for</strong>ecasts.3. When passenger demand increases, air carriers can respond by scheduling extra flights, by using largeraircraft, or by managing higher load fac<strong>to</strong>rs. During <strong>the</strong> 1970s, air carriers accommodated most of <strong>the</strong> growth indemand by introducing larger aircraft. As a result of both increasing aircraft size and improving load fac<strong>to</strong>rs, <strong>the</strong>growth in aircraft movements was quite small in <strong>the</strong> 1970s despite rapid growth in passenger traffic. However, in<strong>the</strong> 1980s, <strong>the</strong> trend in average aircraft size remained almost unchanged as airlines began <strong>to</strong> introduce more midsizeand smaller aircraft in<strong>to</strong> <strong>the</strong>ir fleets. From <strong>the</strong> early 1990s, <strong>the</strong> average aircraft size began <strong>to</strong> decrease and inrecent years, especially in 2001 and 2002, <strong>the</strong> decline has been more pronounced. Past trends in average aircraftsize and average load fac<strong>to</strong>r <strong>for</strong> <strong>to</strong>tal world scheduled services (excluding <strong>the</strong> Commonwealth of IndependentStates) are illustrated in Figure 6-1.4. Gradual improvements in average load fac<strong>to</strong>rs have resulted from marketing initiatives and yieldmanagement programmes, but <strong>the</strong>re is evidence that <strong>the</strong> rate of improvement in load fac<strong>to</strong>rs is slowing down.This is expected as <strong>the</strong> industry gradually approaches upper limits <strong>for</strong> load fac<strong>to</strong>rs, which are partially determinedby periodic and random variations in demand. In recent years, due <strong>to</strong> traffic declines, some markets experiencedexceptionally low load fac<strong>to</strong>rs. In order <strong>to</strong> remedy this situation, capacities were reduced on affected routes. As<strong>the</strong> load fac<strong>to</strong>rs have begun <strong>to</strong> show signs of progressive improvement, it is expected that <strong>the</strong> world averagescheduled passenger load fac<strong>to</strong>r, which increased from 66 per cent in 1992 <strong>to</strong> 71 per cent in 2002, will rise <strong>to</strong>about 73 per cent by <strong>2015</strong>.5. The services provided by carriers <strong>to</strong> meet demand result from a large number of decisions concerningnetwork structure, aircraft types and service frequency. These decisions depend on fac<strong>to</strong>rs such as <strong>the</strong> availabilityof traffic rights, <strong>the</strong> characteristics of alternative aircraft, and consumer preferences and trade-offs between priceand service quality. Despite <strong>the</strong> complexity of this process, it is possible <strong>to</strong> discern several key fac<strong>to</strong>rs which arein part responsible <strong>for</strong> <strong>the</strong> observed change in <strong>the</strong> trend in average aircraft size and hence <strong>the</strong> relationship betweentraffic demand and aircraft movements.6. The first of <strong>the</strong>se fac<strong>to</strong>rs is <strong>the</strong> trend <strong>to</strong>wards liberalization or deregulation in some important markets.Deregulation in <strong>the</strong> United States domestic airline markets began in 1978, followed by gradual liberalization of42
Chapter 6. Forecasts of <strong>Air</strong>craft Movements <strong>to</strong> <strong>the</strong> <strong>Year</strong> <strong>2015</strong> 43200100<strong>Air</strong>craft size(left-hand scale)15075<strong>Air</strong>craft size (seats)100Load fac<strong>to</strong>r(right-hand scale)50Load fac<strong>to</strong>r (%)502501960 63 66 69 72 75 78 81 84 87 90 93 96 99 2002Source: ICAO Reporting Form A-1.Note: Excluding all-freight operations.Excluding <strong>the</strong> CIS.Figure 6-1. Average aircraft size and load fac<strong>to</strong>r — World (1960–2002)(Passenger aircraft on scheduled services)0air services within <strong>the</strong> European Union. The evolution of competitive strategies and market structures hascontinued since <strong>the</strong>n. Adequate frequency and convenient interline and on-line connections, as well as low price,have become important competitive <strong>to</strong>ols. A more liberal regula<strong>to</strong>ry environment has also emerged gradually ino<strong>the</strong>r domestic markets and in international markets. The consequent increased priority given <strong>to</strong> frequency anddirect service has tended <strong>to</strong> increase <strong>the</strong> number of aircraft movements required <strong>to</strong> satisfy a given level of demand.7. The second fac<strong>to</strong>r is <strong>the</strong> arrival of new, mid-size, high-technology aircraft. The 1970s saw B-747, DC-10and L-1011 aircraft absorbed in<strong>to</strong> airline fleets. These aircraft had favourable range and unit cost characteristicsand were at <strong>the</strong> <strong>to</strong>p end of <strong>the</strong> size spectrum. In <strong>the</strong> 1980s, <strong>the</strong> airlines started <strong>to</strong> introduce mid-size aircraft suchas <strong>the</strong> B-757, B-767, MD-80 and A-310. This trend continued well in<strong>to</strong> <strong>the</strong> 1990s, and <strong>the</strong> airlines witnessed <strong>the</strong>introduction of additional mid-size aircraft such as <strong>the</strong> B-777, A-330 and A-340 in<strong>to</strong> <strong>the</strong>ir fleets. Consequently,fleet replacement and expansion led <strong>to</strong> a modest decline in <strong>the</strong> average aircraft size during <strong>the</strong> late 1990s.8. Recent trends have shown that <strong>the</strong>re has been a gradual deployment of mid-size <strong>to</strong> smaller aircraft onalmost all route groups as <strong>the</strong> need <strong>for</strong> more direct services has become a priority <strong>for</strong> travellers. Regula<strong>to</strong>rydevelopments and <strong>the</strong> characteristics of <strong>the</strong>se new aircraft types may have also been prevailing fac<strong>to</strong>rs <strong>for</strong> <strong>the</strong>irintroduction. This change has resulted in a proliferation of services aimed at cost-cutting measures by reducingflight time and <strong>the</strong> distance flown, especially on longer routes linking two regions. Route groups such as NorthAtlantic and Transpacific are <strong>the</strong> prime examples where such aircraft types have increasingly been introduced.
Chapter 6. Forecasts of <strong>Air</strong>craft Movements <strong>to</strong> <strong>the</strong> <strong>Year</strong> <strong>2015</strong> 45d) a growth in average aircraft stage length of 1 per cent per annum.(Because of data constraints, all assumptions and <strong>for</strong>ecasts exclude <strong>the</strong> Commonwealth of Independent States.)FORECASTS OF WORLD SCHEDULED AIRCRAFT MOVEMENTS14. The above analyses resulted in <strong>for</strong>ecast average world annual growth rates of 4.2 per cent <strong>for</strong>aircraft-kilometres and 3.2 per cent <strong>for</strong> aircraft departures over <strong>the</strong> period 2002 <strong>to</strong> <strong>2015</strong>.15. Over <strong>the</strong> <strong>for</strong>ecast horizon, <strong>the</strong> growth rate <strong>for</strong> aircraft-kilometres is below <strong>the</strong> growth rate <strong>for</strong>passenger-kilometres by only 0.2 percentage points per annum because of <strong>the</strong> small increase in load fac<strong>to</strong>r and nochange in aircraft size. Growth in aircraft departures is below <strong>the</strong> growth in aircraft-kilometres by one percentagepoint per annum, which is equal <strong>to</strong> <strong>the</strong> growth in stage length.16. In Table 6-1, <strong>the</strong> <strong>for</strong>ecasts of aircraft movements are compared with actual past movements. The rates ofgrowth reported in <strong>the</strong> table are average measures over <strong>the</strong> relevant 10-year periods; <strong>the</strong> rates over shorter periodsmay vary. The growth in aircraft movements between 1992 and 2002 was almost <strong>the</strong> same when compared with<strong>the</strong> growth between 1982 and 1992. This was a consequence of <strong>the</strong> combined effect of a lower traffic growth,slightly higher load fac<strong>to</strong>rs and a decline in average aircraft size.2 1001 8001 500International servicesKilometres1 200900All services60030001960 63 66 69 72 75 78 81 84 87 90 93 96 99 2002Source: ICAO Reporting Form A-1.Note: Excluding <strong>the</strong> CIS.Figure 6-2. Average aircraft stage length — World (1960–2002)(Scheduled services of airlines of ICAO Contracting States)
Appendix 1ECONOMETRIC MODELS OF DEMANDFOR WORLD SCHEDULED AIR TRAFFICThe basic model <strong>for</strong>m assumed was:y = a x 1b 1 x 2b 2For <strong>the</strong> model of passenger traffic:y= passenger-kilometres per<strong>for</strong>med (PKPs)x 1 = gross domestic product in real terms (GDP)x 2 = passenger revenue per passenger-kilometre in real terms (PYIELD)For <strong>the</strong> model of freight traffic:y= freight <strong>to</strong>nne-kilometres (FTKs)x 1 = world exports in real terms (EXP)x 2 = freight revenue per freight <strong>to</strong>nne-kilometre in real terms (FYIELD)The a, b 1 and b 2 are constant coefficients whose values were obtained by statistical estimation, using econometricanalysis. The b 1 and b 2 are equal <strong>to</strong> <strong>the</strong> elasticities of demand with respect <strong>to</strong> <strong>the</strong> corresponding x 1 and x 2 .Annual data were used in <strong>the</strong> estimations, covering a period of 22 years <strong>for</strong> <strong>the</strong> passenger model and 42 years <strong>for</strong><strong>the</strong> freight model. The data <strong>for</strong> <strong>the</strong> CIS are excluded from <strong>the</strong> freight model. ICAO and <strong>the</strong> IMF were <strong>the</strong> sources<strong>for</strong> <strong>the</strong> airline and general economic data, respectively, used in <strong>the</strong> models.Estimated passenger model:ln PKP = 4.63 + 1.34 ln GDP 0.58 ln PYIELD R 2 = 0.975(2.9) (1.7)Estimated freight model:ln FTK = 0.37 + 1.58 ln EXP 0.37 ln FYIELD R 2 = 0.997(21.4) (5.7)The figures in brackets are <strong>the</strong> “t” values of <strong>the</strong> corresponding coefficient estimates. The “t” value corresponding<strong>to</strong> a particular coefficient estimate is a statistical measure of <strong>the</strong> confidence that can be normally placed in <strong>the</strong>estimate.47
48 <strong>Outlook</strong> <strong>for</strong> <strong>Air</strong> <strong>Transport</strong> <strong>to</strong> <strong>the</strong> <strong>Year</strong> <strong>2015</strong>It should be noted that <strong>the</strong> “t” value corresponding <strong>to</strong> <strong>the</strong> yield in <strong>the</strong> estimated passenger model is less than 2. Ingeneral, <strong>the</strong> larger <strong>the</strong> magnitude of <strong>the</strong> “t” value, <strong>the</strong> greater <strong>the</strong> statistical significance that can be placed uponthat value. However, a low “t” value does not necessarily imply that <strong>the</strong> model is not suitable <strong>for</strong> <strong>for</strong>ecastingpurposes, as in <strong>the</strong> case here. The values of <strong>the</strong> coefficients derived from <strong>the</strong> econometric analysis are relative andnot absolute as bias and variance among coefficients always exist because explana<strong>to</strong>ry variables are not alwaysmutually independent. The R 2 value of 0.975 <strong>for</strong> <strong>the</strong> estimated passenger model indicates that <strong>the</strong> major part of<strong>the</strong> variation of <strong>the</strong> dependent variable, in this case PKP, has been accounted <strong>for</strong> and explained by <strong>the</strong> model. Inaddition, in order <strong>to</strong> measure <strong>the</strong> effectiveness of <strong>the</strong> <strong>for</strong>ecasting application, <strong>the</strong> actual his<strong>to</strong>rical results werecompared with those that were predicted from <strong>the</strong> model and found <strong>to</strong> be satisfac<strong>to</strong>ry.___________________
Appendix 2MODEL FOR AIRCRAFTMOVEMENT FORECASTS1. The relationship between aircraft-kilometres, load fac<strong>to</strong>rs and aircraft size (seats per aircraft) wasdeveloped <strong>for</strong> passenger aircraft as follows:<strong>Air</strong>craft kilometres ==passenger-km(passenger-km/seat-km) • (seat-km/aircraft-km)passenger-km (1)load fac<strong>to</strong>r • aircraft sizeThe <strong>for</strong>ecast <strong>for</strong> aircraft-kilometres <strong>for</strong> scheduled passenger aircraft in <strong>the</strong> year <strong>2015</strong> was generated bysubstituting in<strong>to</strong> this expression <strong>the</strong> assumptions <strong>for</strong> passenger-kilometres, average load fac<strong>to</strong>r and averageaircraft size in <strong>the</strong> year <strong>2015</strong> (excluding <strong>the</strong> Commonwealth of Independent States <strong>for</strong> which some of <strong>the</strong> basedata were not available). The first of <strong>the</strong>se assumptions follows directly from <strong>the</strong> traffic <strong>for</strong>ecast presented inChapter 5.2. The average rate of increase in aircraft-kilometres from 2002 <strong>to</strong> <strong>2015</strong> implied by this <strong>for</strong>ecast was <strong>the</strong>nused <strong>to</strong> calculate <strong>the</strong> <strong>for</strong>ecast number of aircraft-kilometres <strong>for</strong> all scheduled services, including all-freight as wellas combined passenger and freight services (but excluding <strong>the</strong> Commonwealth of Independent States).3. The relationship between aircraft departures, aircraft-kilometres and aircraft stage length <strong>for</strong> passengerand all-freight aircraft combined is derived as follows:<strong>Air</strong>craft departures ==aircraft-kmaircraft-km/aircraft departureaircraft-km (2)stage lengthThe <strong>for</strong>ecast <strong>for</strong> aircraft departures in <strong>the</strong> year <strong>2015</strong> was generated by substituting in<strong>to</strong> this expression <strong>the</strong> <strong>for</strong>ecast<strong>for</strong> aircraft-kilometres and <strong>the</strong> assumption <strong>for</strong> average stage length in <strong>the</strong> year <strong>2015</strong>.4. Equations (1) and (2) can be expressed, approximately, in terms of <strong>the</strong> average annual rates of change of<strong>the</strong> variables over a specified period (e.g. 2002 <strong>to</strong> <strong>2015</strong>).Equation (1) becomes:% (ac-km) % (passenger-km) % (load fac<strong>to</strong>r) % (ac size)Equation (2) becomes:% (ac departures) % (ac-km) % (stage length)where “ac” stands <strong>for</strong> “aircraft” and “%” stands <strong>for</strong> “average annual percentage increase”.49
50 <strong>Outlook</strong> <strong>for</strong> <strong>Air</strong> <strong>Transport</strong> <strong>to</strong> <strong>the</strong> <strong>Year</strong> <strong>2015</strong>5. The actual his<strong>to</strong>rical values and <strong>for</strong>ecast values, as well as <strong>the</strong> corresponding average annual rates ofchange <strong>for</strong> all of <strong>the</strong> variables in equations (1) and (2), are given in Table A2-1.Table A2-1. Growth in aircraft movements andcontributing fac<strong>to</strong>rs World (1982–<strong>2015</strong>)Average annual growth rate(per cent)Actual Actual Actual Forecast1982 1992 2002 <strong>2015</strong> 1982-1992 1992–2002 2002–<strong>2015</strong>Passenger-kilometres (billions) 970 1 782 2 881 5 038 6.3 4.9 4.4Passenger load fac<strong>to</strong>r (%) 61 65 71 73 0.6 0.9 0.2Passenger aircraft size (seats) 181 187 178 178 0.3 0.2 0.2<strong>Air</strong>craft stage length (km) 881 1 047 1 193 1 358 1.7 1.3 1.0<strong>Air</strong>craft-kilometres (millions) 9 140 15 420 23 878 40 750 5.4 4.5 4.2<strong>Air</strong>craft departures (thousands) 10 379 14 728 20 013 30 010 3.6 3.1 3.2Note.— Excluding operations of airlines registered in <strong>the</strong> CIS.— END —