Outlook for Air Transport to the Year 2015 - FILT CGIL Foggia
Outlook for Air Transport to the Year 2015 - FILT CGIL Foggia
Outlook for Air Transport to the Year 2015 - FILT CGIL Foggia

You also want an ePaper? Increase the reach of your titles
YUMPU automatically turns print PDFs into web optimized ePapers that Google loves.
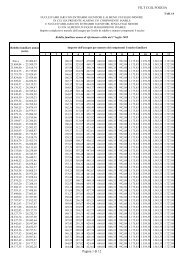
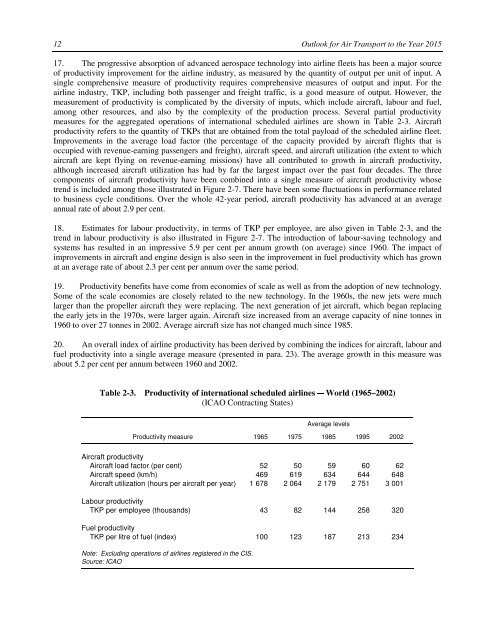
12 <strong>Outlook</strong> <strong>for</strong> <strong>Air</strong> <strong>Transport</strong> <strong>to</strong> <strong>the</strong> <strong>Year</strong> <strong>2015</strong>17. The progressive absorption of advanced aerospace technology in<strong>to</strong> airline fleets has been a major sourceof productivity improvement <strong>for</strong> <strong>the</strong> airline industry, as measured by <strong>the</strong> quantity of output per unit of input. Asingle comprehensive measure of productivity requires comprehensive measures of output and input. For <strong>the</strong>airline industry, TKP, including both passenger and freight traffic, is a good measure of output. However, <strong>the</strong>measurement of productivity is complicated by <strong>the</strong> diversity of inputs, which include aircraft, labour and fuel,among o<strong>the</strong>r resources, and also by <strong>the</strong> complexity of <strong>the</strong> production process. Several partial productivitymeasures <strong>for</strong> <strong>the</strong> aggregated operations of international scheduled airlines are shown in Table 2-3. <strong>Air</strong>craftproductivity refers <strong>to</strong> <strong>the</strong> quantity of TKPs that are obtained from <strong>the</strong> <strong>to</strong>tal payload of <strong>the</strong> scheduled airline fleet.Improvements in <strong>the</strong> average load fac<strong>to</strong>r (<strong>the</strong> percentage of <strong>the</strong> capacity provided by aircraft flights that isoccupied with revenue-earning passengers and freight), aircraft speed, and aircraft utilization (<strong>the</strong> extent <strong>to</strong> whichaircraft are kept flying on revenue-earning missions) have all contributed <strong>to</strong> growth in aircraft productivity,although increased aircraft utilization has had by far <strong>the</strong> largest impact over <strong>the</strong> past four decades. The threecomponents of aircraft productivity have been combined in<strong>to</strong> a single measure of aircraft productivity whosetrend is included among those illustrated in Figure 2-7. There have been some fluctuations in per<strong>for</strong>mance related<strong>to</strong> business cycle conditions. Over <strong>the</strong> whole 42-year period, aircraft productivity has advanced at an averageannual rate of about 2.9 per cent.18. Estimates <strong>for</strong> labour productivity, in terms of TKP per employee, are also given in Table 2-3, and <strong>the</strong>trend in labour productivity is also illustrated in Figure 2-7. The introduction of labour-saving technology andsystems has resulted in an impressive 5.9 per cent per annum growth (on average) since 1960. The impact ofimprovements in aircraft and engine design is also seen in <strong>the</strong> improvement in fuel productivity which has grownat an average rate of about 2.3 per cent per annum over <strong>the</strong> same period.19. Productivity benefits have come from economies of scale as well as from <strong>the</strong> adoption of new technology.Some of <strong>the</strong> scale economies are closely related <strong>to</strong> <strong>the</strong> new technology. In <strong>the</strong> 1960s, <strong>the</strong> new jets were muchlarger than <strong>the</strong> propeller aircraft <strong>the</strong>y were replacing. The next generation of jet aircraft, which began replacing<strong>the</strong> early jets in <strong>the</strong> 1970s, were larger again. <strong>Air</strong>craft size increased from an average capacity of nine <strong>to</strong>nnes in1960 <strong>to</strong> over 27 <strong>to</strong>nnes in 2002. Average aircraft size has not changed much since 1985.20. An overall index of airline productivity has been derived by combining <strong>the</strong> indices <strong>for</strong> aircraft, labour andfuel productivity in<strong>to</strong> a single average measure (presented in para. 23). The average growth in this measure wasabout 5.2 per cent per annum between 1960 and 2002.Table 2-3. Productivity of international scheduled airlines World (1965–2002)(ICAO Contracting States)Average levelsProductivity measure 1965 1975 1985 1995 2002<strong>Air</strong>craft productivity<strong>Air</strong>craft load fac<strong>to</strong>r (per cent) 52 50 59 60 62<strong>Air</strong>craft speed (km/h) 469 619 634 644 648<strong>Air</strong>craft utilization (hours per aircraft per year) 1 678 2 064 2 179 2 751 3 001Labour productivityTKP per employee (thousands) 43 82 144 258 320Fuel productivityTKP per litre of fuel (index) 100 123 187 213 234Note: Excluding operations of airlines registered in <strong>the</strong> CIS.Source: ICAO