Outlook for Air Transport to the Year 2015 - FILT CGIL Foggia
Outlook for Air Transport to the Year 2015 - FILT CGIL Foggia
Outlook for Air Transport to the Year 2015 - FILT CGIL Foggia

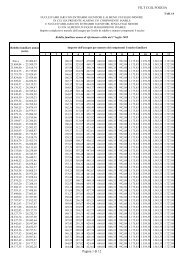
You also want an ePaper? Increase the reach of your titles
YUMPU automatically turns print PDFs into web optimized ePapers that Google loves.
Chapter 4AIRLINE FINANCIAL TRENDSOPERATING REVENUES, EXPENSES AND RESULTSGlobal trends1. This chapter outlines general trends in airline financial data (in current terms unless indicated o<strong>the</strong>rwise)from <strong>the</strong> his<strong>to</strong>rical perspective and, in broad terms, <strong>the</strong> outlook <strong>to</strong> <strong>the</strong> year <strong>2015</strong>. Financial data <strong>for</strong> <strong>the</strong> years 1970,1980 and 1990 as well as <strong>for</strong> <strong>the</strong> period 1992–2002, categorized by major components of operating revenues andexpenses, are given in Table 4-1. The trends in annual operating revenues and expenses <strong>for</strong> <strong>the</strong> period 1992 <strong>to</strong>2002 are illustrated in Figure 4-1. The treatment is global in nature, dealing with <strong>to</strong>tals and averages <strong>for</strong> <strong>the</strong>airlines at <strong>the</strong> global level, and <strong>for</strong> this reason does not show <strong>the</strong> wide differences that exist between regions orindividual carriers. Since <strong>the</strong> available in<strong>for</strong>mation on non-scheduled opera<strong>to</strong>rs is incomplete, <strong>the</strong> analysis isconfined <strong>to</strong> <strong>the</strong> scheduled airlines of ICAO Contracting States (although <strong>the</strong> non-scheduled operations of <strong>the</strong>seairlines are included).2. The long-term his<strong>to</strong>rical trend of <strong>the</strong> financial per<strong>for</strong>mance of scheduled airlines indicates nei<strong>the</strong>r animprovement nor a decline, although fluctuations in <strong>the</strong> operating results occurred over <strong>the</strong> past ten years. During<strong>the</strong> 1983–1989 period, a decrease in fuel costs, along with o<strong>the</strong>r cost reduction and yield control measures,brought about an improvement in <strong>the</strong> financial results of <strong>the</strong> industry which generated a positive net result of4.4 per cent of operating revenues over this period. This trend was reversed in 1990 as a result of a steep increasein fuel prices caused by <strong>the</strong> Gulf crisis, along with a slowdown in <strong>the</strong> world economy. The market conditionschanged as <strong>the</strong> demand weakened and <strong>the</strong> utilization of airline resources tended <strong>to</strong> decline. The emergence ofexcess capacity and consequent competitive pressures put downward pressure on yields. These fac<strong>to</strong>rs combined<strong>to</strong> produce negative operating results in three consecutive years (1990–1992). In 1993, <strong>the</strong> airline industry started<strong>to</strong> move <strong>to</strong>wards a more appropriate balance of supply and demand and achieved a small operating surplus.Between 1994 and 2000, <strong>the</strong> airline industry continued <strong>to</strong> show positive operating results with profit marginsranging between 3.1 and 5.6 per cent of operating revenues. In 2001, shrinking operating revenues, due <strong>to</strong>declining traffic combined with increasing fuel, security and insurance costs, led <strong>to</strong> an unprecedented operationalloss of $11.8 billion and a net loss of $13 billion. In 2002, <strong>the</strong> operating loss is estimated at $4.9 billion and <strong>the</strong>net loss at $11.3 billion (see Table 4-1).3. As shown in Table 4-2, from 1992 <strong>to</strong> 2002 <strong>the</strong> <strong>to</strong>tal operating revenues of <strong>the</strong> world’s scheduled airlinesfrom scheduled and non-scheduled services (including incidental revenues) increased at an average annual rate of3.5 per cent, from $217 800 million <strong>to</strong> $306 000 million. During <strong>the</strong> same period, <strong>the</strong> corresponding <strong>to</strong>taloperating expenses increased at an average annual rate of 3.5 per cent, from $219 600 million <strong>to</strong> $310 900 million.During this period, <strong>the</strong> growth in world airline operating revenues was associated with an average annual growthin <strong>to</strong>tal traffic of 5.7 per cent in terms of TKPs (excluding domestic operations in <strong>the</strong> Russian Federation in 1992)and a decline in airline yields (average operating revenue per <strong>to</strong>nne-kilometre per<strong>for</strong>med) of 2.2 per cent perannum from 90.7 cents in 1992 <strong>to</strong> 72.9 cents in 2002. The unit cost per available <strong>to</strong>nne-kilometre (ATK) declinedby 1.2 per cent from 52.6 cents in 1992 <strong>to</strong> 45.2 cents in 2002. Figure 4-2 presents <strong>the</strong> trends in <strong>the</strong> financialper<strong>for</strong>mance indica<strong>to</strong>rs of <strong>the</strong> global airline industry in terms of unit revenues and costs as well as operating andnet results over <strong>the</strong> 1992–2002 period.24