Outlook for Air Transport to the Year 2015 - FILT CGIL Foggia
Outlook for Air Transport to the Year 2015 - FILT CGIL Foggia
Outlook for Air Transport to the Year 2015 - FILT CGIL Foggia

You also want an ePaper? Increase the reach of your titles
YUMPU automatically turns print PDFs into web optimized ePapers that Google loves.
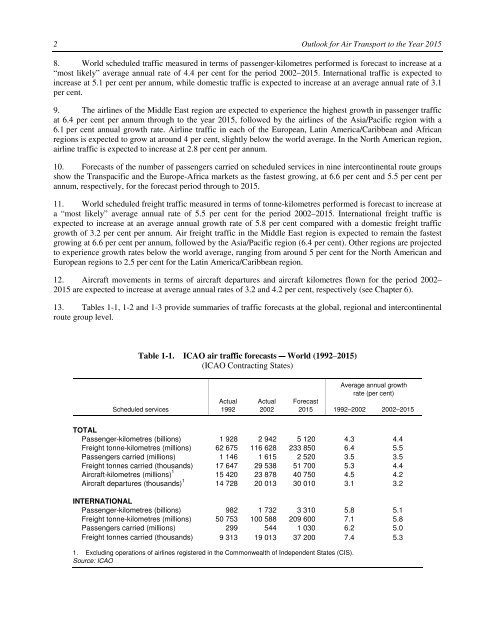
2 <strong>Outlook</strong> <strong>for</strong> <strong>Air</strong> <strong>Transport</strong> <strong>to</strong> <strong>the</strong> <strong>Year</strong> <strong>2015</strong>8. World scheduled traffic measured in terms of passenger-kilometres per<strong>for</strong>med is <strong>for</strong>ecast <strong>to</strong> increase at a“most likely” average annual rate of 4.4 per cent <strong>for</strong> <strong>the</strong> period 2002–<strong>2015</strong>. International traffic is expected <strong>to</strong>increase at 5.1 per cent per annum, while domestic traffic is expected <strong>to</strong> increase at an average annual rate of 3.1per cent.9. The airlines of <strong>the</strong> Middle East region are expected <strong>to</strong> experience <strong>the</strong> highest growth in passenger trafficat 6.4 per cent per annum through <strong>to</strong> <strong>the</strong> year <strong>2015</strong>, followed by <strong>the</strong> airlines of <strong>the</strong> Asia/Pacific region with a6.1 per cent annual growth rate. <strong>Air</strong>line traffic in each of <strong>the</strong> European, Latin America/Caribbean and Africanregions is expected <strong>to</strong> grow at around 4 per cent, slightly below <strong>the</strong> world average. In <strong>the</strong> North American region,airline traffic is expected <strong>to</strong> increase at 2.8 per cent per annum.10. Forecasts of <strong>the</strong> number of passengers carried on scheduled services in nine intercontinental route groupsshow <strong>the</strong> Transpacific and <strong>the</strong> Europe-Africa markets as <strong>the</strong> fastest growing, at 6.6 per cent and 5.5 per cent perannum, respectively, <strong>for</strong> <strong>the</strong> <strong>for</strong>ecast period through <strong>to</strong> <strong>2015</strong>.11. World scheduled freight traffic measured in terms of <strong>to</strong>nne-kilometres per<strong>for</strong>med is <strong>for</strong>ecast <strong>to</strong> increase ata “most likely” average annual rate of 5.5 per cent <strong>for</strong> <strong>the</strong> period 2002–<strong>2015</strong>. International freight traffic isexpected <strong>to</strong> increase at an average annual growth rate of 5.8 per cent compared with a domestic freight trafficgrowth of 3.2 per cent per annum. <strong>Air</strong> freight traffic in <strong>the</strong> Middle East region is expected <strong>to</strong> remain <strong>the</strong> fastestgrowing at 6.6 per cent per annum, followed by <strong>the</strong> Asia/Pacific region (6.4 per cent). O<strong>the</strong>r regions are projected<strong>to</strong> experience growth rates below <strong>the</strong> world average, ranging from around 5 per cent <strong>for</strong> <strong>the</strong> North American andEuropean regions <strong>to</strong> 2.5 per cent <strong>for</strong> <strong>the</strong> Latin America/Caribbean region.12. <strong>Air</strong>craft movements in terms of aircraft departures and aircraft kilometres flown <strong>for</strong> <strong>the</strong> period 2002–<strong>2015</strong> are expected <strong>to</strong> increase at average annual rates of 3.2 and 4.2 per cent, respectively (see Chapter 6).13. Tables 1-1, 1-2 and 1-3 provide summaries of traffic <strong>for</strong>ecasts at <strong>the</strong> global, regional and intercontinentalroute group level.Table 1-1. ICAO air traffic <strong>for</strong>ecasts World (1992–<strong>2015</strong>)(ICAO Contracting States)Average annual growthrate (per cent)Actual Actual ForecastScheduled services 1992 2002 <strong>2015</strong> 1992–2002 2002–<strong>2015</strong>TOTALPassenger-kilometres (billions) 1 928 2 942 5 120 4.3 4.4Freight <strong>to</strong>nne-kilometres (millions) 62 675 116 628 233 850 6.4 5.5Passengers carried (millions) 1 146 1 615 2 520 3.5 3.5Freight <strong>to</strong>nnes carried (thousands) 17 647 29 538 51 700 5.3 4.4<strong>Air</strong>craft-kilometres (millions) 1 15 420 23 878 40 750 4.5 4.2<strong>Air</strong>craft departures (thousands) 1 14 728 20 013 30 010 3.1 3.2INTERNATIONALPassenger-kilometres (billions) 982 1 732 3 310 5.8 5.1Freight <strong>to</strong>nne-kilometres (millions) 50 753 100 588 209 600 7.1 5.8Passengers carried (millions) 299 544 1 030 6.2 5.0Freight <strong>to</strong>nnes carried (thousands) 9 313 19 013 37 200 7.4 5.31. Excluding operations of airlines registered in <strong>the</strong> Commonwealth of Independent States (CIS).Source: ICAO