Outlook for Air Transport to the Year 2015 - FILT CGIL Foggia
Outlook for Air Transport to the Year 2015 - FILT CGIL Foggia
Outlook for Air Transport to the Year 2015 - FILT CGIL Foggia

You also want an ePaper? Increase the reach of your titles
YUMPU automatically turns print PDFs into web optimized ePapers that Google loves.
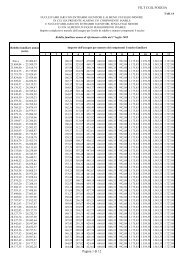
36 <strong>Outlook</strong> <strong>for</strong> <strong>Air</strong> <strong>Transport</strong> <strong>to</strong> <strong>the</strong> <strong>Year</strong> <strong>2015</strong>and <strong>2015</strong>. In absolute terms, <strong>the</strong> increase in passenger-kilometres during <strong>the</strong> <strong>for</strong>ecast period is expected <strong>to</strong> besome 2 180 billion, which is more than twice <strong>the</strong> 1 013 billion increase during <strong>the</strong> period 1992–2002. Theabsolute increase in passengers carried is projected <strong>to</strong> be slightly above 900 million by <strong>2015</strong>, compared with469 million between 1992 and 2002.REGIONAL PASSENGER FORECASTS14. The “most likely” <strong>for</strong>ecasts of scheduled airline passenger traffic by region of airline registration aregiven in Table 5-2, <strong>to</strong>ge<strong>the</strong>r with his<strong>to</strong>rical figures <strong>for</strong> 1992 and 2002. The airlines of <strong>the</strong> Middle East andAsia/Pacific regions are expected <strong>to</strong> show <strong>the</strong> highest growth in passenger traffic, at 6.4 per cent and 6.1 per centper annum respectively, through <strong>to</strong> <strong>the</strong> year <strong>2015</strong>, while <strong>the</strong> airlines of North America are anticipated <strong>to</strong> show <strong>the</strong>lowest growth, around 2.8 per cent per annum. Traffic of <strong>the</strong> airlines of <strong>the</strong> African and <strong>the</strong> LatinAmerica/Caribbean regions are expected <strong>to</strong> grow at about 4 per cent per annum, whereas traffic of Europeanairlines is <strong>for</strong>ecast <strong>to</strong> grow at 4.1 per cent, slightly below <strong>the</strong> world average.15. As a result of <strong>the</strong> projected growth in passenger traffic, <strong>the</strong> airlines of <strong>the</strong> Asia/Pacific region areexpected <strong>to</strong> increase <strong>the</strong>ir share of world passenger traffic (in terms of passenger-kilometres) by about6.5 percentage points <strong>to</strong> 33.2 per cent, with <strong>the</strong>ir share of <strong>to</strong>tal international scheduled passenger traffic increasing<strong>to</strong> about 37 per cent, both traffic shares being <strong>the</strong> highest among all <strong>the</strong> regions.16. A significant change in regional share is expected <strong>to</strong> occur in North America, whose airlines’ share isanticipated <strong>to</strong> decline by about 6.5 percentage points <strong>to</strong> 30.3 per cent by <strong>the</strong> year <strong>2015</strong>. The shares of internationaland domestic scheduled traffic of North America are expected <strong>to</strong> decrease, but <strong>the</strong> region will still hold <strong>the</strong>highest share of world domestic traffic at 58.6 per cent. The shares of airlines of o<strong>the</strong>r regions are anticipated <strong>to</strong>remain almost unchanged.PASSENGER FORECASTS FORINTERCONTINENTAL ROUTE GROUPS17. The <strong>for</strong>ecasts of <strong>the</strong> number of passengers carried on scheduled services in nine intercontinental routegroups, accounting <strong>for</strong> almost 38 per cent of international passengers in 2002, are presented in Table 5-3. For <strong>the</strong>majority of <strong>the</strong>se route groups, growth rates <strong>for</strong> <strong>the</strong> 2002–<strong>2015</strong> period are <strong>for</strong>ecast <strong>to</strong> be slightly lower than during<strong>the</strong> 1992–2002 period. Traffic across <strong>the</strong> North Atlantic suffered a major setback due <strong>to</strong> <strong>the</strong> events of11 September 2001 and has since been declining; however, it is expected <strong>to</strong> recover and grow at <strong>the</strong> worldaverage. The Transpacific route group is expected <strong>to</strong> grow fastest among <strong>the</strong> nine route groups at an averageannual rate of 6.6 per cent.18. Since 2001, <strong>the</strong> route groups <strong>to</strong>/from Europe have experienced a slowdown in <strong>the</strong>ir growth rates but areanticipated <strong>to</strong> increase at about <strong>the</strong> same rate as in <strong>the</strong> past decade, except <strong>for</strong> <strong>the</strong> Europe-Asia/Pacific marketwhich is expected <strong>to</strong> grow at about 2 percentage points lower than in <strong>the</strong> past decade, thus achieving <strong>the</strong> sameaverage as <strong>the</strong> world during <strong>the</strong> <strong>for</strong>ecast period.19. The remaining route groups shown in Table 5-3 are smaller in terms of passenger numbers. Their growthrates up <strong>to</strong> <strong>the</strong> year <strong>2015</strong> are projected <strong>to</strong> range from a high of 4.9 per cent <strong>for</strong> <strong>the</strong> Mid-Atlantic <strong>to</strong> a low of 4.5 percent <strong>for</strong> <strong>the</strong> South Atlantic and <strong>the</strong> North America-South America route groups. The growth in air travel demandin most of <strong>the</strong>se markets is supported by competitive services and by growth in leisure travel.