Outlook for Air Transport to the Year 2015 - FILT CGIL Foggia
Outlook for Air Transport to the Year 2015 - FILT CGIL Foggia
Outlook for Air Transport to the Year 2015 - FILT CGIL Foggia

You also want an ePaper? Increase the reach of your titles
YUMPU automatically turns print PDFs into web optimized ePapers that Google loves.
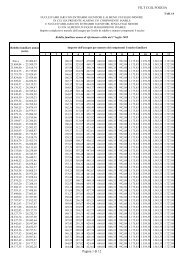
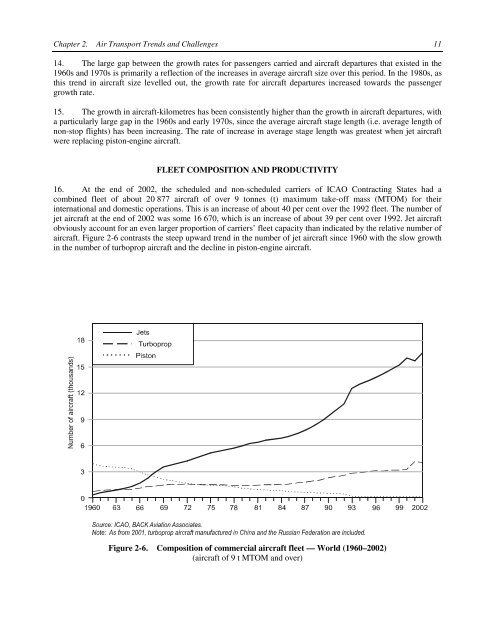
Chapter 2. <strong>Air</strong> <strong>Transport</strong> Trends and Challenges 1114. The large gap between <strong>the</strong> growth rates <strong>for</strong> passengers carried and aircraft departures that existed in <strong>the</strong>1960s and 1970s is primarily a reflection of <strong>the</strong> increases in average aircraft size over this period. In <strong>the</strong> 1980s, asthis trend in aircraft size levelled out, <strong>the</strong> growth rate <strong>for</strong> aircraft departures increased <strong>to</strong>wards <strong>the</strong> passengergrowth rate.15. The growth in aircraft-kilometres has been consistently higher than <strong>the</strong> growth in aircraft departures, witha particularly large gap in <strong>the</strong> 1960s and early 1970s, since <strong>the</strong> average aircraft stage length (i.e. average length ofnon-s<strong>to</strong>p flights) has been increasing. The rate of increase in average stage length was greatest when jet aircraftwere replacing pis<strong>to</strong>n-engine aircraft.FLEET COMPOSITION AND PRODUCTIVITY16. At <strong>the</strong> end of 2002, <strong>the</strong> scheduled and non-scheduled carriers of ICAO Contracting States had acombined fleet of about 20 877 aircraft of over 9 <strong>to</strong>nnes (t) maximum take-off mass (MTOM) <strong>for</strong> <strong>the</strong>irinternational and domestic operations. This is an increase of about 40 per cent over <strong>the</strong> 1992 fleet. The number ofjet aircraft at <strong>the</strong> end of 2002 was some 16 670, which is an increase of about 39 per cent over 1992. Jet aircraf<strong>to</strong>bviously account <strong>for</strong> an even larger proportion of carriers’ fleet capacity than indicated by <strong>the</strong> relative number ofaircraft. Figure 2-6 contrasts <strong>the</strong> steep upward trend in <strong>the</strong> number of jet aircraft since 1960 with <strong>the</strong> slow growthin <strong>the</strong> number of turboprop aircraft and <strong>the</strong> decline in pis<strong>to</strong>n-engine aircraft.Figure 2-6. Composition of commercial aircraft fleet — World (1960–2002)(aircraft of 9 t MTOM and over)