Outlook for Air Transport to the Year 2015 - FILT CGIL Foggia
Outlook for Air Transport to the Year 2015 - FILT CGIL Foggia
Outlook for Air Transport to the Year 2015 - FILT CGIL Foggia

Create successful ePaper yourself
Turn your PDF publications into a flip-book with our unique Google optimized e-Paper software.
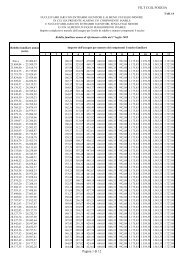
Chapter 1. Summary 3Table 1-2. ICAO air traffic <strong>for</strong>ecasts Regions of airline registration (1992–<strong>2015</strong>)(ICAO Contracting States)Average annual growthrate (per cent)Scheduled services by region Actual Actual Forecas<strong>to</strong>f airline registration 1992 2002 <strong>2015</strong> 1992–2002 2002–<strong>2015</strong>TOTALPassenger-kilometres (billions)Africa 42.9 66.2 110 4.4 4.0Asia/Pacific 409.2 785.1 1 700 6.7 6.1Europe 525.7 769.7 1 300 3.9 4.1Middle East 53.4 106.7 240 7.2 6.4North America 806.4 1 082.3 1 550 3.0 2.8Latin America and Caribbean 90.9 132.3 220 3.8 4.0Freight <strong>to</strong>nne-kilometres (millions)Africa 1 238 1 856 3 100 4.1 4.0Asia/Pacific 19 410 42 062 94 600 8.0 6.4Europe 19 460 32 828 61 000 5.4 4.9Middle East 2 625 5 355 12 250 7.4 6.6North America 16 867 30 586 57 500 6.1 5.0Latin America and Caribbean 3 075 3 940 5 400 2.5 2.5INTERNATIONALPassenger-kilometres (billions)Africa 34.9 57.5 100 5.1 4.3Asia/Pacific 276.8 537.6 1 220 6.9 6.5Europe 330.8 643.8 1 150 6.9 4.6Middle East 44.5 93.5 220 7.7 6.8North America 238.8 322.4 490 3.0 3.3Latin America and Caribbean 56.4 77.4 130 3.2 3.9Freight <strong>to</strong>nne-kilometres (millions)Africa 1 135 1 777 3 000 4.6 4.1Asia/Pacific 17 752 38 196 86 500 8.0 6.5Europe 17 680 32 019 60 000 6.1 4.9Middle East 2 552 5 251 12 100 7.5 6.6North America 9 114 20 264 44 000 8.3 6.1Latin America and Caribbean 2 520 3 079 4 000 2.0 2.0Source: ICAO