Outlook for Air Transport to the Year 2015 - FILT CGIL Foggia
Outlook for Air Transport to the Year 2015 - FILT CGIL Foggia
Outlook for Air Transport to the Year 2015 - FILT CGIL Foggia

Create successful ePaper yourself
Turn your PDF publications into a flip-book with our unique Google optimized e-Paper software.
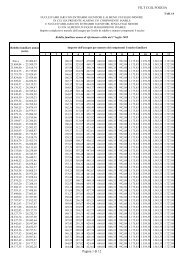
Chapter 5. Forecasts of <strong>Air</strong>line Traffic <strong>to</strong> <strong>the</strong> <strong>Year</strong> <strong>2015</strong> 37Table 5-2. ICAO scheduled passenger traffic Regions of airline registration (1992–<strong>2015</strong>)(ICAO Contracting States)Passenger-kilometres(billions)Average annual growthrate (per cent)Regional share of worldtraffic (per cent)Actual1992Actual2002Forecast<strong>2015</strong> 1992–2002 2002–<strong>2015</strong> 1992 2002 <strong>2015</strong>AfricaTotal 42.9 66.2 110 4.4 4.0 2.2 2.2 2.1International 34.9 57.5 100 5.1 4.3 3.6 3.3 3.0Domestic 8.0 8.7 10 0.8 1.1 0.8 0.7 0.6Asia/PacificTotal 409.2 785.1 1 700 6.7 6.1 21.2 26.7 33.2International 276.9 537.6 1 220 6.9 6.5 28.2 31.0 36.9Domestic 132.3 247.5 480 6.5 5.2 14.0 20.5 26.5EuropeTotal 525.7 769.7 1 300 3.9 4.1 27.3 26.2 25.4International 330.8 643.8 1 150 6.9 4.6 33.7 37.2 34.7Domestic 194.9 125.9 150 4.3 1.4 20.6 10.4 8.3Middle EastTotal 53.4 106.7 240 7.2 6.4 2.8 3.6 4.7International 44.5 93.5 220 7.7 6.8 4.5 5.4 6.6Domestic 8.9 13.2 20 4.0 3.2 0.9 1.1 1.1North AmericaTotal 806.4 1 082.3 1 550 3.0 2.8 41.8 36.8 30.3International 238.8 322.4 490 3.0 3.3 24.3 18.6 14.8Domestic 567.6 759.9 1 060 3.0 2.6 60.0 62.8 58.6Latin America/CaribbeanTotal 90.9 132.3 220 3.8 4.0 4.7 4.5 4.3International 56.4 77.4 130 3.2 4.1 5.7 4.5 3.9Domestic 34.5 54.9 90 4.8 3.9 3.6 4.5 5.0WorldTotal 1 928.5 2 942.3 5 120 4.3 4.4 100.0 100.0 100.0International 982.3 1 732.2 3 310 5.8 5.1 100.0 100.0 100.0Domestic 946.2 1 210.1 1 810 2.5 3.1 100.0 100.0 100.0GLOBAL FREIGHT FORECASTS20. The econometric analysis, <strong>to</strong>ge<strong>the</strong>r with <strong>the</strong> assumptions mentioned earlier, resulted in a “most likely”projected growth rate of 5.5 per cent per annum <strong>for</strong> world scheduled freight <strong>to</strong>nne-kilometres <strong>for</strong> <strong>the</strong> period 2002–<strong>2015</strong>. This is about one percentage point lower than <strong>the</strong> 6.4 per cent per annum <strong>for</strong> <strong>the</strong> 1992–2002 period.Alternative assumptions concerning <strong>the</strong> underlying fac<strong>to</strong>rs affecting air freight suggest a band of <strong>for</strong>ecast growthrates ranging from a “low” of 3.5 per cent per annum <strong>to</strong> a “high” of 7.3 per cent per annum as illustrated inFigure 5-2.