Outlook for Air Transport to the Year 2015 - FILT CGIL Foggia
Outlook for Air Transport to the Year 2015 - FILT CGIL Foggia
Outlook for Air Transport to the Year 2015 - FILT CGIL Foggia

Create successful ePaper yourself
Turn your PDF publications into a flip-book with our unique Google optimized e-Paper software.
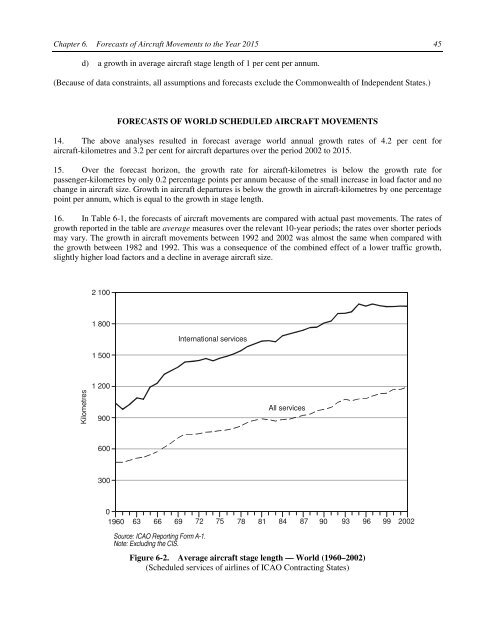
Chapter 6. Forecasts of <strong>Air</strong>craft Movements <strong>to</strong> <strong>the</strong> <strong>Year</strong> <strong>2015</strong> 45d) a growth in average aircraft stage length of 1 per cent per annum.(Because of data constraints, all assumptions and <strong>for</strong>ecasts exclude <strong>the</strong> Commonwealth of Independent States.)FORECASTS OF WORLD SCHEDULED AIRCRAFT MOVEMENTS14. The above analyses resulted in <strong>for</strong>ecast average world annual growth rates of 4.2 per cent <strong>for</strong>aircraft-kilometres and 3.2 per cent <strong>for</strong> aircraft departures over <strong>the</strong> period 2002 <strong>to</strong> <strong>2015</strong>.15. Over <strong>the</strong> <strong>for</strong>ecast horizon, <strong>the</strong> growth rate <strong>for</strong> aircraft-kilometres is below <strong>the</strong> growth rate <strong>for</strong>passenger-kilometres by only 0.2 percentage points per annum because of <strong>the</strong> small increase in load fac<strong>to</strong>r and nochange in aircraft size. Growth in aircraft departures is below <strong>the</strong> growth in aircraft-kilometres by one percentagepoint per annum, which is equal <strong>to</strong> <strong>the</strong> growth in stage length.16. In Table 6-1, <strong>the</strong> <strong>for</strong>ecasts of aircraft movements are compared with actual past movements. The rates ofgrowth reported in <strong>the</strong> table are average measures over <strong>the</strong> relevant 10-year periods; <strong>the</strong> rates over shorter periodsmay vary. The growth in aircraft movements between 1992 and 2002 was almost <strong>the</strong> same when compared with<strong>the</strong> growth between 1982 and 1992. This was a consequence of <strong>the</strong> combined effect of a lower traffic growth,slightly higher load fac<strong>to</strong>rs and a decline in average aircraft size.2 1001 8001 500International servicesKilometres1 200900All services60030001960 63 66 69 72 75 78 81 84 87 90 93 96 99 2002Source: ICAO Reporting Form A-1.Note: Excluding <strong>the</strong> CIS.Figure 6-2. Average aircraft stage length — World (1960–2002)(Scheduled services of airlines of ICAO Contracting States)