- Page 1 and 2:
The Impact
- Page 3 and 4:
- 3 -DanksagungDie Arbeit an der vo
- Page 5 and 6:
- 5 -HilfsmittelThe</strong
- Page 7 and 8:
- 7 -3.1 Cross section of</
- Page 9 and 10:
- 9 -Chapter I:Introduction
- Page 11 and 12:
- 11 -2 Theoretica
- Page 13 and 14:
- 13 -rights 14 . Similar empirical
- Page 15 and 16:
- 15 -under specific circumstances
- Page 17 and 18:
- 17 -3 Switzerland as a Perfect La
- Page 19 and 20:
- 19 -Chapter II:Direct</st
- Page 21 and 22:
- 21 -(Verwaltungsreferendum), a re
- Page 23 and 24:
- 23 -Landsgemeinde cantons, i.e. t
- Page 25 and 26:
- 25 -Table 1: Changes of</
- Page 27 and 28:
- 27 -precisely specified. Moreover
- Page 29 and 30:
- 29 -CantonLuzern(21 Oct 2003)Uri(
- Page 31 and 32:
- 31 -Waadt(old)CantonWallis(21 Oct
- Page 33 and 34:
- 33 -Table 3: Requirements for a S
- Page 35 and 36:
- 35 -caused a duplication
- Page 37 and 38:
- 37 -During the time period under
- Page 39 and 40:
- 39 -constitution, the stipulation
- Page 41 and 42:
- 41 -Table 4: Mandatory Statutory
- Page 43 and 44:
- 43 -Table 4: Mandatory Statutory
- Page 45 and 46:
- 45 -A similar but less drastic re
- Page 47 and 48:
- 47 -present members so demand (ar
- Page 49 and 50:
- 49 -Table 5: Optional Statutory R
- Page 51 and 52:
- 51 -Table 5: Optional Statutory R
- Page 53 and 54:
- 53 -Table 5: Optional Statutory R
- Page 55 and 56:
- 55 -requirement of</stron
- Page 57 and 58:
- 57 -The cantonal
- Page 59 and 60:
- 59 -CantonObwalden(22 Oct 2002)Ta
- Page 61 and 62:
- 61 -CantonSt. Gallen(old)Graubün
- Page 63 and 64:
- 63 -also be observed in the canto
- Page 65 and 66:
- 65 -5.3. Optional Fiscal Referend
- Page 67 and 68:
- 67 -CantonSolothurn(30 Mar 2004)B
- Page 69 and 70:
- 69 -CantonWaadt(21 Oct 2003)newco
- Page 71 and 72:
- 71 -respect to the extraordinary
- Page 73 and 74:
- 73 -new optional (fiscal) referen
- Page 75 and 76:
- 75 -awarded based on its requirem
- Page 77 and 78:
- 77 -Hence, in these cantons, the
- Page 79 and 80:
- 79 -higher (4.417 instead <strong
- Page 81 and 82:
- 81 -democracy. Hence, the majorit
- Page 83 and 84:
- 83 -Chapter III:Happiness
- Page 85 and 86:
- 85 -equilibrium. 81 Consequently,
- Page 87 and 88:
- 87 -are difficult to measure and
- Page 89 and 90:
- 89 -a weighted ordered probit mod
- Page 91 and 92:
- 91 -In general, how satisfied are
- Page 93 and 94:
- 93 -dichotomous variable indicati
- Page 95 and 96:
- 95 -obvious that omitting the lan
- Page 97 and 98:
- 97 -Table 2: Results for Differen
- Page 99 and 100:
- 99 -significant impact on persona
- Page 101 and 102:
- 101 -Table 3a: Personal Subjectiv
- Page 103 and 104:
- 103 -Table3c: Personal Subjective
- Page 105 and 106:
- 105 -result from the creation by
- Page 107 and 108:
- 107 -5 AppendixTable A.1: Distrib
- Page 109 and 110:
- 109 -Table A2: Results for Switze
- Page 111 and 112:
- 111 -Table A.3: Descriptive Stati
- Page 113 and 114:
- 113 -Chapter IV:Income Redistribu
- Page 115 and 116:
- 115 -The latter
- Page 117 and 118:
- 117 -coalition because they can e
- Page 119 and 120:
- 119 -wing parties. If additional
- Page 121 and 122:
- 121 -democracy as an explanatory
- Page 123 and 124:
- 123 -political process. In genera
- Page 125 and 126:
- 125 -democracy does not appear to
- Page 127 and 128:
- 127 -Table 1: Fiscal Referenda an
- Page 129 and 130:
- 129 -The more fi
- Page 131 and 132:
- 131 -NER (2001), who argue that d
- Page 133 and 134:
- 133 -redistribution, the cross se
- Page 135 and 136: - 135 -Table 3: Inequality and Redi
- Page 137 and 138: - 137 -some political scientists: <
- Page 139 and 140: - 139 -8 AppendixTable A.1: Expendi
- Page 141 and 142: - 141 -Chapter V:Public Safety
- Page 143 and 144: - 143 -average probabilities. An op
- Page 145 and 146: - 145 -legislative institution itse
- Page 147 and 148: - 147 -death less probable than oth
- Page 149 and 150: - 149 -2.4 The Rol
- Page 151 and 152: - 151 -Testable Hypothesis 1:<stron
- Page 153 and 154: - 153 -(1) log O = f (D 1 , D 2 , Y
- Page 155 and 156: - 155 -Higher clear-up and detectio
- Page 157 and 158: - 157 -Following the procedure <str
- Page 159 and 160: - 159 -(per capita) 188 . In this s
- Page 161 and 162: - 161 -Regarding the additional fis
- Page 163 and 164: - 163 -Table 3: Property Crime 1986
- Page 165 and 166: - 165 -from 1986 to 2001, it is pic
- Page 167 and 168: - 167 -Table 4: Violent Crime and S
- Page 169 and 170: - 169 -In sum, in the structural mo
- Page 171 and 172: - 171 -same. It is for robbery and
- Page 173 and 174: - 173 -Violent CrimeTable 6 display
- Page 175 and 176: - 175 -Table 6: Violent Crime and S
- Page 177 and 178: - 177 -the policemen in direct demo
- Page 179 and 180: - 179 -becoming a victim of
- Page 181 and 182: - 181 -Table A.2: Security Expendit
- Page 183 and 184: - 183 -Table A.4: Summary Statistic
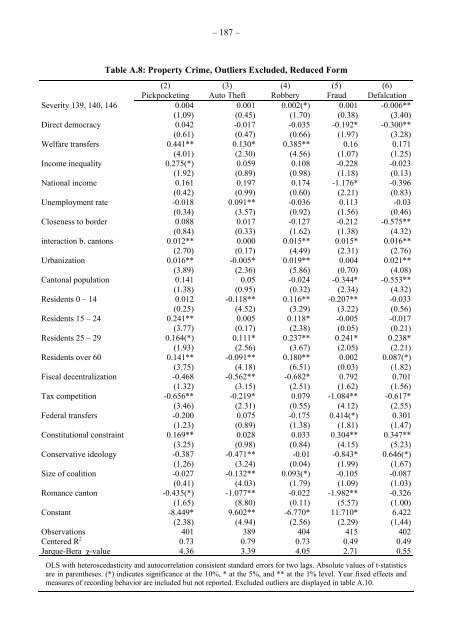
- Page 185: - 185 -Table A.6: Property Crime, O
- Page 189 and 190: - 189 -Table A.10: Deleted Observat
- Page 191 and 192: - 191 -Table A.11: Description <str
- Page 194 and 195: - 194 -Questionnaires
- Page 196 and 197: - 196 -Halten Sie die Erfassungspra
- Page 198 and 199: - 198 -Frage:Was wird neben dem Die
- Page 200 and 201: - 200 -Est-ce que vous jugez la pra
- Page 202 and 203: - 202 -Question:Les catégories sui
- Page 204 and 205: - 204 -1 IntroductionDirect
- Page 206 and 207: - 206 -possible to analyze the impa
- Page 208 and 209: - 208 -2.3 U.S. Empirical Evidence
- Page 210 and 211: - 210 -political autonomy by the Sw
- Page 212 and 213: - 212 -weakly induces more spending
- Page 214 and 215: - 214 -economics literature. In gen
- Page 216 and 217: - 216 -of the scho
- Page 218 and 219: - 218 -2002) 249 . One exception is
- Page 220 and 221: - 220 -4.2 Quantile Regression Resu
- Page 222 and 223: - 222 -quantiles, the index <strong
- Page 224 and 225: - 224 -the corresponding subject. <
- Page 226 and 227: - 226 -that the H 0 -hypothesis <st
- Page 228 and 229: - 228 -Overall, the robustness test
- Page 230 and 231: - 230 -average student is found for
- Page 232 and 233: - 232 -appears to be influential in
- Page 234 and 235: - 234 -Regarding the direct impact
- Page 236 and 237:
- 236 -application of</stro
- Page 238 and 239:
- 238 -Table 8.1: OLS Regressions f
- Page 240 and 241:
- 240 -Table 8.2: Quantile Regressi
- Page 242 and 243:
- 242 -Table 8.3: Quantile Regressi
- Page 244 and 245:
- 244 -Table 8.3: Quantile Regressi
- Page 246 and 247:
- 246 -Table 9.1: OLS Regression fo
- Page 248 and 249:
- 248 -Table 9.2: Quantile Regressi
- Page 250 and 251:
- 250 -Table 9.3: Quantile Regressi
- Page 252 and 253:
- 252 -Table 9.3: Quantile Regressi
- Page 254 and 255:
- 254 -Table 10.1: OLS Regression f
- Page 256 and 257:
- 256 -Table 10.2: Quantile Regress
- Page 258 and 259:
- 258 -Table 10.3: Quantile Regress
- Page 260 and 261:
- 260 -Table 10.3: Quantile Regress
- Page 262 and 263:
- 262 -11 Appendix: Descriptive Sta
- Page 264 and 265:
- 264 -Selective schoolRegular test
- Page 266 and 267:
- 266 -Table 11.2: Indices
- Page 268 and 269:
- 268 -Table 11.4: Descriptive Stat
- Page 270 and 271:
- 270 -Chapter VII:Conclusion
- Page 272 and 273:
- 272 -should lead, on average, to
- Page 274 and 275:
- 274 -References
- Page 276 and 277:
- 276 -ARTALE, A. and H.-P. GRÜNER
- Page 278 and 279:
- 278 -CARD, D. and A. PAYNE (2002)
- Page 280 and 281:
- 280 -EASTERLIN, R.A. (1974), Does
- Page 282 and 283:
- 282 -FELD, L.P. and J.G. MATSUSAK
- Page 284 and 285:
- 284 -FREY, B.S. and A. STUTZER (2
- Page 286 and 287:
- 286 -HANUSHEK, E.A. (1986), <stro
- Page 288 and 289:
- 288 -KESSLER, A. (2003), Represen
- Page 290 and 291:
- 290 -LEHMAN, D.R., R.O. LEMPERT a
- Page 292 and 293:
- 292 -MORGAN, M.C. and M. HENRION
- Page 294 and 295:
- 294 -PROKHOROV, A.V., C. WARNEKE,
- Page 296 and 297:
- 296 -SCHALTEGGER, CH. and L.P: FE
- Page 298 and 299:
- 298 -TRECHSEL, A. and U. SERDÜLT
- Page 300:
- 300 -Curriculum VitaeBorn on the