

64 Elementary Education in India - Where do we stand ? - DISE
64 Elementary Education in India - Where do we stand ? - DISE
64 Elementary Education in India - Where do we stand ? - DISE

Create successful ePaper yourself
Turn your PDF publications into a flip-book with our unique Google optimized e-Paper software.
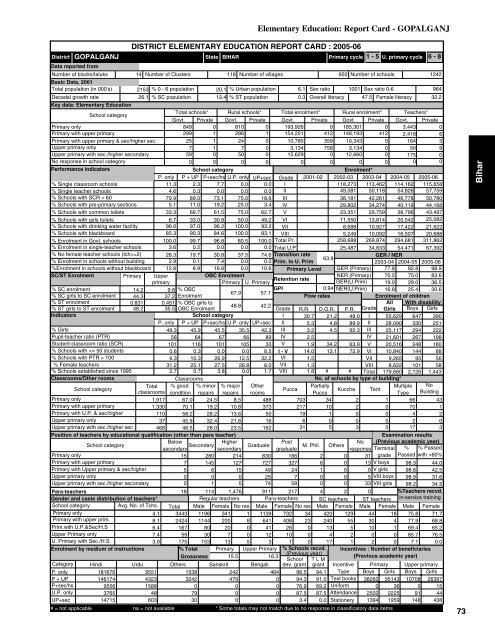
GOPALGANJDistrictData reported fromNumber of blocks/taluksBasic Data, 2001Total population (<strong>in</strong> 000's)Decadal growth rateDISTRICT ELEMENTARY EDUCATION REPORT CARD : 2005-06StateBIHAR14 Number of Clusters 118 Number of villages950 Number of schools12422153 % 0 - 6 population 20.1 % Urban population 6.1 Sex ratio 1001 Sex ratio 0-69<strong>64</strong>26.1 % SC population 12.4 % ST population0.3 Overall literacy 47.5 Female literacy 32.2Primary cycle 1 - 5 U. primary cycle 6 - 8Key data: <strong>Elementary</strong> <strong>Education</strong>School categoryTotal schools* Rural schools* Total enrolment* Rural enrolment* Teachers*Govt. Private Govt. Private Govt. Private Govt Private Govt. PrivatePrimary only849 0 810 0 193,926 0 185,301 0 3,443 0Primary with upper primary299 1 286 1 154,251 412 148,193 412 2,418 6Primary with upper primary & sec/higher sec.25 1 24 0 10,785 359 10,343 0 1<strong>64</strong> 3Upper primary only7 1 7 0 3,134 758 3,134 0 50 9Upper primary with sec./higher secondary59 0 50 0 15,629 0 12,660 0 175 0No response <strong>in</strong> school category0 0 0 0 0 0 0 0 0 0Performance <strong>in</strong>dicatorsSchool categoryEnrolment*P. only P + UP P+sec/hs U.P. only UP+sec Grade 2001-02 2002-03 2003-04 2004-05 2005-06% S<strong>in</strong>gle classroom schools11.3 2.3 7.7 0.0 0.0 I118,273 113,462 114,162 115,658% S<strong>in</strong>gle teacher schools4.6 0.3 0.0 0.0 0.0 II49,081 50,118 54,826 57,759% Schools with SCR > 6079.9 89.0 73.1 75.0 18.6 III38,181 42,261 46,778 50,780% Schools with pre-primary sections 5.1 11.0 19.2 25.0 3.4 IV29,802 34,274 40,119 44,168% Schools with common toilets 33.3 69.7 61.5 75.0 62.7 V23,351 29,759 38,796 43,497% Schools with girls toilets 6.7 33.0 30.8 50.0 49.2 VI11,550 13,814 20,542 25,082% Schools with dr<strong>in</strong>k<strong>in</strong>g water facility 96.0 97.0 96.2 100.0 93.2 VII8,688 10,927 17,422 21,622% Schools with blackboard85.3 90.3 84.6 100.0 83.1 VIII 5,249 10,092 16,507 20,688% Enrolment <strong>in</strong> Govt. schools 100.0 99.7 96.8 80.5 100.0 Total Pr. 258,688 269,874 294,681 311,862% Enrolment <strong>in</strong> s<strong>in</strong>gle-teacher schools3.6 0.2 0.0 0.0 0.0 Total U.P25,487 34,833 54,471 67,392% No female teacher schools (tch>=2) 28.3 19.7 30.8 37.5 74.6 Transition rateGER / NER63.9% Enrolment <strong>in</strong> schools without build<strong>in</strong>g 2.9 0.1 7.4 0.0 0.0 Prim. to U. Prim2003-04 2004-05 2005-06%Enrolment <strong>in</strong> schools without blackboard 12.8 8.9 16.8 0.0 10.6 Primary Level GER (Primary) 77.8 82.8 98.9SC/ST EnrolmentPrimary UpperOBC EnrolmentNER (Primary) 70.5 75.0 83.6Retention rateprimaryPrimary U. PrimaryGER(U.Prim) 19.0 29.0 36.5% SC enrolment14.2 9.8 % OBCGPI0.94 NER(U.Prim) 16.8 25.4 30.667.9 57.1% SC girls to SC enrolment 44.3 37.2 EnrolmentFlow ratesEnrolment of children% ST enrolment0.831 0.451 % OBC girls toAll With disability48.8 42.2% ST girls to ST enrolment 48.2 35.5 OBC EnrolmentGrade R.R. D.O.R. P.R. Grade Girls Boys GirlsIndicatorsSchool categoryI 30.7 21.2 48.0 I 55,629 <strong>64</strong>7 390P. only P + UP P+sec/hs U.P. only UP+sec II 5.3 4.8 89.9 II 28,090 330 251% Girls49.3 45.9 45.5 35.5 42.3 III 3.2 4.5 92.3 III 25,117 294 222Pupil-teacher ratio (PTR)56 <strong>64</strong> 67 66 89 IV 2.5IV 21,601 267 198Student-classroom ratio (SCR)101 116 101 105 33 V 1.9 34.2 63.9 V 20,516 248 180% Schools with 1009.3 10.3 26.9 12.5 32.2 VI 1.5VII 9,265 95 56% Female teachers31.2 25.1 27.5 28.8 8.0 VII 1.3VIII 8,622 101 58% Schools established s<strong>in</strong>ce 19952.7 0.7 3.8 0.0 1.7 VIII 1.8 # # Total 179,680 2,126 1,443Classrooms/Other roomsClassroomsNo. of schools by type of build<strong>in</strong>g*School categoryTotal % good % m<strong>in</strong>or % major OtherPartiallyMultiple NoPuccaKuccha Tentclassrooms condition repairs repairs roomsPuccaType Build<strong>in</strong>gPrimary only1,917 67.0 24.5 8.5 488 703 34 2 1 66 43Primary with upper primary1,330 70.1 19.2 10.8 373 217 10 2 0 70 1Primary with U.P. & sec/higher110 58.2 28.2 13.6 5019 1 0 0 4 2Upper primary only37 45.9 32.4 21.6 166 0 0 0 2 0Upper primary with sec./higher sec 468 48.5 28.0 23.5 16231 5 3 0 17 3Position of teachers by educational qualification (other than para teacher)Exam<strong>in</strong>ation resultsSchool category BelowHigherPost(Previous academic year)M. Phil.secondarysecondarygraduateNoresponse Term<strong>in</strong>al % % Passed15 280 214 830 166 2 0 31 grade Passed with >60%V boysPrimary onlyPrimary with upper primaryPrimary with Upper primary & sec/higherUpper primary onlyUpper primary with sec./higher secondaryPara-teachersGender and caste distribution of teachers*School categoryAvg. No. of Tchs.Primary only4.1 3443 1196Primary with upper prim.8.1 2424 1144 200 8 <strong>64</strong>1Prim.with U.P.&Sec/H.S6.4 167 80 20 0 41Upper Primary only7.4 59 30 7 0 12U. Primary with Sec./H.S.3.0 175 153 13 5 3Enrolment by medium of <strong>in</strong>structions% Total Primary Upper PrimaryGrossness 15.5 16.3Category H<strong>in</strong>di Urdu Others Sanskrit BengaliP. only181676955115382424<strong>64</strong>P + UP146174432332424790P+sec/hs95561588000U.P. only3765487900UP+sec147156033000<strong>Elementary</strong> <strong>Education</strong>: Report Card - GOPALGANJ7 145 127 727 327 6 0 135 6 15 49 24 1 0 0 V girls0 0 0 25 7 0 0 5 VIII boys0 1 5 74 58 0 0 33 VIII girls18 114 1,476 911 217 4 2 0Regular teachers Para-teachers SC teachers ST teachersTotal Male Female No res Male Female No res Male Female Male Female341 1 1139 732 34 420 129 44 1840826102300240134555230100Male Female75.8 71.777.9 68.869.4 65.285.7 76.51 0 17 1 2 0 7.1 0.0% Schools recvd. Incentives : Number of beneficiaries(Previous year)(Previous academic year)School T L Mdev. grant grant Incentive Primary Upper primary96.5 94.1 Type Boys Girls Boys Girls94.3 91.0 Text books 38260 95143 10708 2639776.9 69.2 Uniform0 36 0 1587.5 87.5 Attendance 2502 2225 91 443.4 0.0 Stationery 1394 1959 148 438# = not applicable na = not available * Some totals may not match due to no response <strong>in</strong> classificatory data items41098.3 44.098.6 42.598.9 31.698.2 34.5%Teachers recvd.<strong>in</strong>-service tra<strong>in</strong><strong>in</strong>g73Bihar


