

64 Elementary Education in India - Where do we stand ? - DISE
64 Elementary Education in India - Where do we stand ? - DISE
64 Elementary Education in India - Where do we stand ? - DISE

Create successful ePaper yourself
Turn your PDF publications into a flip-book with our unique Google optimized e-Paper software.
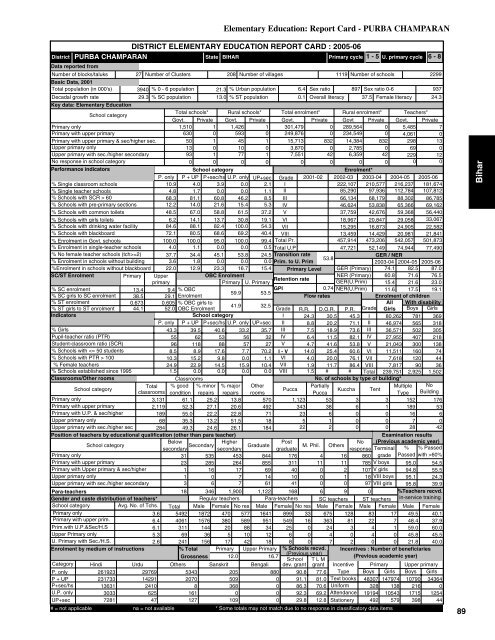
DISTRICT ELEMENTARY EDUCATION REPORT CARD : 2005-06PURBA CHAMPARANState BIHARDistrictData reported fromNumber of blocks/taluksBasic Data, 2001Total population (<strong>in</strong> 000's)Decadal growth rate27 Number of Clusters 208 Number of villages1119 Number of schools22993940 % 0 - 6 population 21.3 % Urban population 6.4 Sex ratio 897 Sex ratio 0-693729.3 % SC population 13.0 % ST population0.1 Overall literacy 37.5 Female literacy 24.3Primary cycle 1 - 5 U. primary cycle 6 - 8Key data: <strong>Elementary</strong> <strong>Education</strong>School categoryTotal schools* Rural schools* Total enrolment* Rural enrolment* Teachers*Govt. Private Govt. Private Govt. Private Govt Private Govt. PrivatePrimary only1,510 1 1,426 1 301,479 0 289,5<strong>64</strong> 0 5,485 7Primary with upper primary630 0 593 0 249,876 0 234,549 0 4,061 0Primary with upper primary & sec/higher sec.50 1 45 1 15,713 832 14,384 832 298 13Upper primary only13 0 10 0 3,870 0 2,785 0 69 0Upper primary with sec./higher secondary93 1 77 1 7,551 42 6,359 42 229 12No response <strong>in</strong> school category0 0 0 0 0 0 0 0 0 0Performance <strong>in</strong>dicatorsSchool categoryEnrolment*P. only P + UP P+sec/hs U.P. only UP+sec Grade 2001-02 2002-03 2003-04 2004-05 2005-06% S<strong>in</strong>gle classroom schools10.9 4.0 3.9 0.0 2.1 I222,107 210,577 216,237 181,674% S<strong>in</strong>gle teacher schools4.8 1.7 0.0 0.0 1.1 II85,290 97,936 112,784 107,812% Schools with SCR > 6068.3 81.1 60.8 46.2 8.5 III66,134 68,179 88,302 86,785% Schools with pre-primary sections 12.2 14.0 21.6 15.4 5.3 IV46,624 53,838 65,366 69,162% Schools with common toilets 48.5 67.0 58.8 61.5 37.2 V37,759 42,676 59,368 56,440% Schools with girls toilets 6.2 14.1 13.7 30.8 19.1 VI18,967 20,847 29,058 33,067% Schools with dr<strong>in</strong>k<strong>in</strong>g water facility 84.6 88.1 82.4 100.0 54.3 VII15,295 16,873 24,905 22,582% Schools with blackboard72.1 80.5 68.6 69.2 40.4 VIII 13,459 14,429 20,981 21,841% Enrolment <strong>in</strong> Govt. schools 100.0 100.0 95.0 100.0 99.4 Total Pr. 457,914 473,206 542,057 501,873% Enrolment <strong>in</strong> s<strong>in</strong>gle-teacher schools4.0 1.1 0.0 0.0 0.5 Total U.P47,721 52,149 74,944 77,490% No female teacher schools (tch>=2) 37.7 34.4 45.1 53.8 24.5 Transition rateGER / NER53.8% Enrolment <strong>in</strong> schools without build<strong>in</strong>g 3.6 1.8 0.0 0.0 0.0 Prim. to U. Prim2003-04 2004-05 2005-06%Enrolment <strong>in</strong> schools without blackboard 22.0 12.9 23.3 16.7 15.4 Primary Level GER (Primary) 74.1 82.5 87.0SC/ST EnrolmentPrimary UpperOBC EnrolmentNER (Primary) 60.8 71.6 76.5Retention rateprimaryPrimary U. PrimaryGER(U.Prim) 15.4 21.6 23.0% SC enrolment13.4 9.4 % OBCGPI0.74 NER(U.Prim) 11.6 17.5 19.159.9 53.5% SC girls to SC enrolment 38.5 29.1 EnrolmentFlow ratesEnrolment of children% ST enrolment0.673 0.605 % OBC girls toAll With disability41.9 32.5% ST girls to ST enrolment 44.1 52.0 OBC EnrolmentGrade R.R. D.O.R. P.R. Grade Girls Boys GirlsIndicatorsSchool categoryI 24.3 30.5 45.3 I 80,262 781 369P. only P + UP P+sec/hs U.P. only UP+sec II 8.8 20.2 71.1 II 46,974 565 318% Girls43.3 39.5 40.6 33.2 35.7 III 7.5 18.9 73.6 III 36,571 502 305Pupil-teacher ratio (PTR)55 62 53 56 32 IV 6.4 11.5 82.1 IV 27,955 407 218Student-classroom ratio (SCR)96 118 88 57 27 V 4.7 41.6 53.8 V 21,043 300 138% Schools with 10010.3 15.2 9.8 0.0 1.1 VI 4.0 20.0 76.1 VII 7,618 120 44% Female teachers24.9 22.9 14.5 15.9 10.4 VII 1.9 11.7 86.4 VIII 7,817 90 36% Schools established s<strong>in</strong>ce 19951.5 0.0 0.0 0.0 0.0 VIII 1.5 # # Total 239,751 2,925 1,502Classrooms/Other roomsClassroomsNo. of schools by type of build<strong>in</strong>g*School categoryTotal % good % m<strong>in</strong>or % major OtherPartiallyMultiple NoPuccaKuccha Tentclassrooms condition repairs repairs roomsPuccaType Build<strong>in</strong>gPrimary only3,131 61.1 25.2 13.8 570 1,123 53 3 3 152 176Primary with upper primary2,119 52.3 27.1 20.6 492 343 38 6 1 189 53Primary with U.P. & sec/higher189 55.0 22.2 22.8 7123 6 0 0 16 6Upper primary only68 35.3 13.2 51.5 185 1 0 0 7 0Upper primary with sec./higher sec 284 49.3 24.6 26.1 18422 2 0 0 28 42Position of teachers by educational qualification (other than para teacher)Exam<strong>in</strong>ation resultsSchool category BelowHigherPost(Previous academic year)M. Phil.secondarysecondarygraduateNoresponse Term<strong>in</strong>al % % Passed31 535 453 844 176 4 16 860 grade Passed with >60%V boysPrimary onlyPrimary with upper primaryPrimary with Upper primary & sec/higherUpper primary onlyUpper primary with sec./higher secondaryPara-teachersGender and caste distribution of teachers*School categoryAvg. No. of Tchs.Primary only3.6 5492 1872Primary with upper prim.6.4 4061 1576 380 589 951Prim.with U.P.&Sec/H.S6.1 311 144 20 88 34Upper Primary only5.3 69 36 5 10 12U. Primary with Sec./H.S.2.6 241 156 17 42 18Enrolment by medium of <strong>in</strong>structions% Total Primary Upper PrimaryGrossness 12.0 16.7Category H<strong>in</strong>di Urdu Others Sanskrit BengaliP. only261923297695343205880P + UP2317331429120705090P+sec/hs13631241083680U.P. only303362516100UP+sec7281471271090<strong>Elementary</strong> <strong>Education</strong>: Report Card - PURBA CHAMPARAN23 285 2<strong>64</strong> 855 311 11 11 7851 16 17 69 40 0 2 107 V girls1 0 7 14 10 0 1 18 VIII boys3 6 7 61 41 0 0 97 VIII girls18 346 1,900 1,122 168 6 9 0Regular teachers Para-teachers SC teachers ST teachersTotal Male Female No res Male Female No res Male Female Male Female470 577 1<strong>64</strong>1 899 33 675 128 83 1754925616003632448130Male Female49.5 40.148.4 37.959.0 60.045.8 45.58 0 7 2 0 0 21.8 40.0% Schools recvd. Incentives : Number of beneficiaries(Previous year)(Previous academic year)School T L Mdev. grant grant Incentive Primary Upper primary90.8 77.6 Type Boys Girls Boys Girls91.1 81.0 Text books 48307 147974 10790 343<strong>64</strong>86.3 70.6 Uniform 328 138 216 092.3 69.2 Attendance 19194 10543 1715 125429.8 12.8 Stationery 492 579 398 44# = not applicable na = not available * Some totals may not match due to no response <strong>in</strong> classificatory data items224471095.0 54.594.8 55.595.1 24.395.8 39.9%Teachers recvd.<strong>in</strong>-service tra<strong>in</strong><strong>in</strong>g89Bihar


