64 Elementary Education in India - Where do we stand ? - DISE
64 Elementary Education in India - Where do we stand ? - DISE
64 Elementary Education in India - Where do we stand ? - DISE
You also want an ePaper? Increase the reach of your titles
YUMPU automatically turns print PDFs into web optimized ePapers that Google loves.
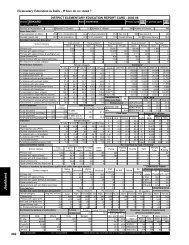
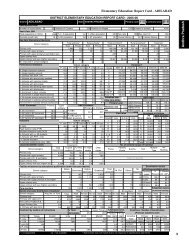
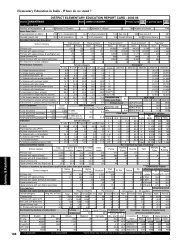
Bihar82<strong>Elementary</strong> <strong>Education</strong> <strong>in</strong> <strong>India</strong> - <strong>Where</strong> <strong>do</strong> <strong>we</strong> <strong>stand</strong> ?MADHUBANIDistrictData reported fromNumber of blocks/taluksBasic Data, 2001Total population (<strong>in</strong> 000's)Decadal growth rateDISTRICT ELEMENTARY EDUCATION REPORT CARD : 2005-06StateBIHAR21 Number of Clusters 182 Number of villages956 Number of schools25933575 % 0 - 6 population 20.3 % Urban population 3.5 Sex ratio 942 Sex ratio 0-693926.1 % SC population 13.5 % ST population na Overall literacy 42.0 Female literacy 26.3Primary cycle 1 - 5 U. primary cycle 6 - 8Key data: <strong>Elementary</strong> <strong>Education</strong>School categoryTotal schools* Rural schools* Total enrolment* Rural enrolment* Teachers*Govt. Private Govt. Private Govt. Private Govt Private Govt. PrivatePrimary only1,742 3 1,691 3 342,384 426 333,135 426 6,026 4Primary with upper primary583 56 563 56 276,229 13,428 2<strong>64</strong>,184 13,428 4,276 313Primary with upper primary & sec/higher sec.19 39 18 36 5,128 13,175 4,919 11,445 110 291Upper primary only13 1 13 1 4,671 366 4,671 366 83 11Upper primary with sec./higher secondary130 7 118 7 15,035 379 13,889 379 616 31No response <strong>in</strong> school category0 0 0 0 0 0 0 0 0 0Performance <strong>in</strong>dicatorsSchool categoryEnrolment*P. only P + UP P+sec/hs U.P. only UP+sec Grade 2001-02 2002-03 2003-04 2004-05 2005-06% S<strong>in</strong>gle classroom schools12.0 2.0 3.4 7.1 1.5 I163,959 147,152 141,195 161,233% S<strong>in</strong>gle teacher schools6.4 0.5 1.7 0.0 2.9 II102,995 115,378 114,475 119,000% Schools with SCR > 6076.0 82.0 34.5 85.7 6.6 III70,063 94,318 106,858 109,940% Schools with pre-primary sections 0.3 1.3 13.8 0.0 0.0 IV56,929 <strong>64</strong>,657 85,924 97,291% Schools with common toilets 12.9 58.1 34.5 <strong>64</strong>.3 45.3 V47,861 55,096 <strong>64</strong>,049 80,227% Schools with girls toilets 2.5 17.7 12.1 28.6 19.0 VI26,452 29,989 36,353 42,505% Schools with dr<strong>in</strong>k<strong>in</strong>g water facility 93.9 89.5 82.8 100.0 79.6 VII22,824 25,914 30,815 34,478% Schools with blackboard76.1 75.9 39.7 <strong>64</strong>.3 49.6 VIII 16,370 18,473 24,183 26,547% Enrolment <strong>in</strong> Govt. schools 99.9 95.4 28.0 92.7 97.5 Total Pr. 441,807 476,601 512,501 567,691% Enrolment <strong>in</strong> s<strong>in</strong>gle-teacher schools5.1 0.4 1.2 0.0 0.8 Total U.P65,<strong>64</strong>6 74,376 91,351 103,530% No female teacher schools (tch>=2) 34.7 28.0 81.0 42.9 59.9 Transition rateGER / NER<strong>64</strong>.0% Enrolment <strong>in</strong> schools without build<strong>in</strong>g 1.2 0.7 0.0 0.0 0.5 Prim. to U. Prim2003-04 2004-05 2005-06%Enrolment <strong>in</strong> schools without blackboard 22.4 20.5 55.1 23.7 41.5 Primary Level GER (Primary) 82.8 86.7 108.4SC/ST EnrolmentPrimary UpperOBC EnrolmentNER (Primary) 72.4 76.6 95.3Retention rateprimaryPrimary U. PrimaryGER(U.Prim) 24.4 29.2 33.8% SC enrolment14.5 8.2 % OBCGPI0.78 NER(U.Prim) 20.4 24.9 28.561.6 53.5% SC girls to SC enrolment 40.3 26.0 EnrolmentFlow ratesEnrolment of children% ST enrolment0.145 0.118 % OBC girls toAll With disability43.2 32.1% ST girls to ST enrolment 33.3 30.3 OBC EnrolmentGrade R.R. D.O.R. P.R. Grade Girls Boys GirlsIndicatorsSchool categoryI 26.6I 74,681 <strong>64</strong>0 328P. only P + UP P+sec/hs U.P. only UP+sec II 8.9 1.6 89.5 II 53,255 515 334% Girls44.9 40.5 40.3 32.1 31.7 III 7.0 6.6 86.4 III 47,744 617 325Pupil-teacher ratio (PTR)57 63 46 54 24 IV 5.7 6.3 88.0 IV 41,370 585 304Student-classroom ratio (SCR)94 96 46 88 26 V 7.3 28.7 <strong>64</strong>.0 V 31,362 457 209% Schools with 10010.7 11.6 3.4 7.1 0.0 VI 4.1 5.0 90.8 VII 12,238 1<strong>64</strong> 66% Female teachers27.6 23.6 8.0 21.3 4.9 VII 4.7 12.5 82.7 VIII 9,145 72 20% Schools established s<strong>in</strong>ce 199513.6 0.5 1.7 0.0 0.0 VIII 4.4 # # Total 284,938 3,266 1,668Classrooms/Other roomsClassroomsNo. of schools by type of build<strong>in</strong>g*School categoryTotal % good % m<strong>in</strong>or % major OtherPartiallyMultiple NoPuccaKuccha Tentclassrooms condition repairs repairs roomsPuccaType Build<strong>in</strong>gPrimary only3,658 63.6 24.1 12.3 745 1,598 27 8 1 66 45Primary with upper primary3,003 66.0 19.7 14.3 846 441 29 13 0 144 12Primary with U.P. & sec/higher398 68.8 19.8 11.3 15632 1 4 0 19 2Upper primary only57 52.6 15.8 31.6 409 0 0 0 5 0Upper primary with sec./higher sec 588 68.9 12.9 18.2 52592 5 0 0 24 16Position of teachers by educational qualification (other than para teacher)Exam<strong>in</strong>ation resultsSchool category BelowHigherPost(Previous academic year)M. Phil.secondarysecondarygraduateNoresponse Term<strong>in</strong>al % % Passed13 826 4<strong>64</strong> 1,017 349 3 5 20 grade Passed with >60%V boysPrimary onlyPrimary with upper primaryPrimary with Upper primary & sec/higherUpper primary onlyUpper primary with sec./higher secondaryPara-teachersGender and caste distribution of teachers*School categoryAvg. No. of Tchs.Primary only3.5 6030 2260Primary with upper prim.7.2 4589 2594 433 3 911Prim.with U.P.&Sec/H.S6.9 401 367 31 0 2Upper Primary only6.7 94 60 9 0 14U. Primary with Sec./H.S.4.7 <strong>64</strong>7 614 32 1 0Enrolment by medium of <strong>in</strong>structions% Total Primary Upper PrimaryGrossness 12.2 15.6Category H<strong>in</strong>di Urdu Sanskrit OthersP. only3017394078900P + UP2653122133717860P+sec/hs40011380400U.P. only5037000UP+sec14772175269916 552 495 1,203 737 9 5 138 45 71 97 167 0 8 2 V girls1 7 10 33 18 0 0 0 VIII boys0 3 2 258 372 9 1 2 VIII girls7 618 2,437 1,469 326 6 2 0Regular teachers Para-teachers SC teachers ST teachersTotal Male Female No res Male Female No res Male Female Male Female426 11 2086 1241 6 798 161 92 24<strong>64</strong>81110004175117302Male Female42.8 36.841.9 41.13.5 0.041.9 60.00 0 21 0 7 0 0.7 0.0% Schools recvd. Incentives : Number of beneficiaries(Previous year)(Previous academic year)School T L Mdev. grant grant Incentive Primary Upper primary84.8 75.9 Type Boys Girls Boys Girls75.4 75.0 Text books 40120 159275 8359 3121225.9 32.8 Uniform 336 99 91 692.9 85.7 Attendance 4357 2759 504 2573.6 0.0 Stationery 377 99 79 23# = not applicable na = not available * Some totals may not match due to no response <strong>in</strong> classificatory data items381030099.4 40.099.1 39.699.4 19.799.3 21.6%Teachers recvd.<strong>in</strong>-service tra<strong>in</strong><strong>in</strong>g


