

64 Elementary Education in India - Where do we stand ? - DISE
64 Elementary Education in India - Where do we stand ? - DISE
64 Elementary Education in India - Where do we stand ? - DISE

You also want an ePaper? Increase the reach of your titles
YUMPU automatically turns print PDFs into web optimized ePapers that Google loves.
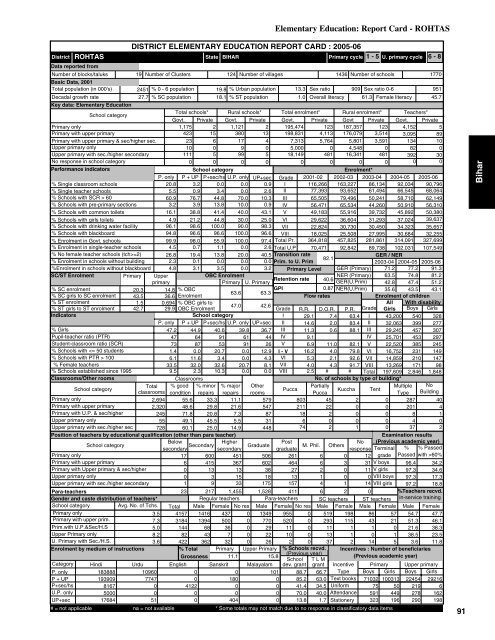
ROHTASDistrictData reported fromNumber of blocks/taluksBasic Data, 2001Total population (<strong>in</strong> 000's)Decadal growth rateDISTRICT ELEMENTARY EDUCATION REPORT CARD : 2005-06StateBIHAR19 Number of Clusters 124 Number of villages1436 Number of schools17702451 % 0 - 6 population 19.8 % Urban population 13.3 Sex ratio 909 Sex ratio 0-695127.7 % SC population 18.1 % ST population1.0 Overall literacy 61.3 Female literacy 45.7Primary cycle 1 - 5 U. primary cycle 6 - 8Key data: <strong>Elementary</strong> <strong>Education</strong>School categoryTotal schools* Rural schools* Total enrolment* Rural enrolment* Teachers*Govt. Private Govt. Private Govt. Private Govt Private Govt. PrivatePrimary only1,175 2 1,121 2 195,474 123 187,357 123 4,152 5Primary with upper primary423 15 380 13 198,831 4,113 176,079 3,514 3,095 89Primary with upper primary & sec/higher sec.23 6 17 4 7,313 5,7<strong>64</strong> 5,801 3,591 134 10Upper primary only10 0 9 0 5,000 0 4,548 0 82 0Upper primary with sec./higher secondary111 5 99 5 18,149 481 16,341 481 392 30No response <strong>in</strong> school category0 0 0 0 0 0 0 0 0 0Performance <strong>in</strong>dicatorsSchool categoryEnrolment*P. only P + UP P+sec/hs U.P. only UP+sec Grade 2001-02 2002-03 2003-04 2004-05 2005-06% S<strong>in</strong>gle classroom schools20.8 3.2 0.0 0.0 0.9 I 116,266 163,227 86,134 92,034 90,796% S<strong>in</strong>gle teacher schools5.5 0.9 3.4 0.0 2.6 II 77,393 93,652 61,494 66,545 68,0<strong>64</strong>% Schools with SCR > 6060.9 76.7 44.8 70.0 10.3 III 65,505 79,496 50,241 58,710 62,149% Schools with pre-primary sections 3.2 3.9 13.8 10.0 0.9 IV 56,471 65,534 44,260 50,910 56,310% Schools with common toilets 16.1 38.8 41.4 40.0 43.1 V 49,183 55,916 39,732 45,892 50,380% Schools with girls toilets 4.9 21.2 44.8 30.0 25.0 VI 29,622 36,604 31,293 37,024 39,637% Schools with dr<strong>in</strong>k<strong>in</strong>g water facility 96.1 98.6 100.0 90.0 98.3 VII 22,824 30,730 30,450 34,323 35,657% Schools with blackboard94.8 96.6 96.6 100.0 96.6 VIII 18,025 25,508 27,995 30,684 32,255% Enrolment <strong>in</strong> Govt. schools 99.9 98.0 55.9 100.0 97.4 Total Pr. 3<strong>64</strong>,818 457,825 281,861 314,091 327,699% Enrolment <strong>in</strong> s<strong>in</strong>gle-teacher schools4.5 0.7 1.1 0.0 2.6 Total U.P 70,471 92,842 89,738 102,031 107,549% No female teacher schools (tch>=2) 26.8 19.4 13.8 20.0 40.5 Transition rateGER / NER82.1% Enrolment <strong>in</strong> schools without build<strong>in</strong>g 2.3 0.1 0.0 0.0 0.0 Prim. to U. Prim2003-04 2004-05 2005-06%Enrolment <strong>in</strong> schools without blackboard 4.8 3.1 3.5 0.0 3.2 Primary Level GER (Primary) 71.2 77.2 91.3SC/ST EnrolmentPrimary UpperOBC EnrolmentNER (Primary) 63.5 74.8 81.2Retention rate 40.6primaryPrimary U. PrimaryGER(U.Prim) 42.8 47.4 51.2% SC enrolment20.3 14.8 % OBCGPI0.87 NER(U.Prim) 35.6 43.5 43.163.6 63.3% SC girls to SC enrolment 43.5 36.6 EnrolmentFlow ratesEnrolment of children% ST enrolment1.5 0.694 % OBC girls toAll With disability47.0 42.6% ST girls to ST enrolment 42.7 29.9 OBC EnrolmentGrade R.R. D.O.R. P.R. Grade Girls Boys GirlsIndicatorsSchool categoryI 29.1 7.4 63.4 I 43,200 540 328P. only P + UP P+sec/hs U.P. only UP+sec II 14.6 2.0 83.4 II 32,063 399 277% Girls47.2 44.9 40.6 39.8 36.7 III 11.3 0.6 88.1 III 29,245 457 307Pupil-teacher ratio (PTR)47 <strong>64</strong> 91 61 44 IV 9.1IV 25,701 453 297Student-classroom ratio (SCR)73 87 53 91 26 V 6.9 11.0 82.1 V 22,520 385 245% Schools with 1006.1 11.6 3.4 0.0 4.3 VI 5.3 2.1 92.6 VII 14,859 210 147% Female teachers33.5 32.0 32.6 20.7 8.1 VII 4.0 4.3 91.7 VIII 13,269 171 98% Schools established s<strong>in</strong>ce 19959.5 2.3 10.3 0.0 0.0 VIII 2.5 # # Total 197,609 2,846 1,848Classrooms/Other roomsClassroomsNo. of schools by type of build<strong>in</strong>g*School categoryTotal % good % m<strong>in</strong>or % major OtherPartiallyMultiple NoPuccaKuccha Tentclassrooms condition repairs repairs roomsPuccaType Build<strong>in</strong>gPrimary only2,694 55.6 33.3 11.1 579 803 45 2 0 287 40Primary with upper primary2,320 48.6 29.8 21.6 547 211 22 0 0 201 4Primary with U.P. & sec/higher245 71.8 20.8 7.3 8718 2 0 0 8 1Upper primary only55 49.1 45.5 5.5 316 0 0 0 4 0Upper primary with sec./higher sec 728 60.1 25.0 14.9 44874 2 1 0 37 2Position of teachers by educational qualification (other than para teacher)Exam<strong>in</strong>ation resultsSchool category BelowHigherPost(Previous academic year)M. Phil.secondarysecondarygraduateNoresponse Term<strong>in</strong>al % % Passed17 600 451 506 261 6 0 12 grade Passed with >60%V boysPrimary onlyPrimary with upper primaryPrimary with Upper primary & sec/higherUpper primary onlyUpper primary with sec./higher secondaryPara-teachersGender and caste distribution of teachers*School categoryAvg. No. of Tchs.Primary only3.5 4157 1416Primary with upper prim.7.3 3184 1394 500 0 770Prim.with U.P.&Sec/H.S5.0 144 68 36 0 29Upper Primary only8.2 82 43 7 0 22U. Primary with Sec./H.S.3.6 422 362 32 0 26Enrolment by medium of <strong>in</strong>structions% Total Primary Upper PrimaryGrossness 11.1 15.8Category H<strong>in</strong>di Urdu English Sanskrit MalayalamP. only1838881096000101P + UP193909774701800P+sec/hs81670412200U.P. only50000000UP+sec176845104040<strong>Elementary</strong> <strong>Education</strong>: Report Card - ROHTAS6 415 367 602 4<strong>64</strong> 6 3 310 13 13 38 27 2 0 11 V girls0 3 15 18 13 1 0 0 VIII boys1 9 33 175 157 4 1 14 VIII girls23 217 1,455 1,528 411 6 2 0Regular teachers Para-teachers SC teachers ST teachersTotal Male Female No res Male Female No res Male Female Male Female437 0 1349 955 0 519 198 86 575201110000293111311511Male Female54.7 47.751.3 46.121.6 38.338.5 23.52 0 37 2 14 5 3.6 11.8% Schools recvd. Incentives : Number of beneficiaries(Previous year)(Previous academic year)School T L Mdev. grant grant Incentive Primary Upper primary88.7 66.7 Type Boys Girls Boys Girls85.2 63.0 Text books 71032 100313 22454 2921<strong>64</strong>1.4 34.5 Uniform 75 50 219 670.0 40.0 Attendance 591 449 278 16213.8 1.7 Stationery 323 196 290 198# = not applicable na = not available * Some totals may not match due to no response <strong>in</strong> classificatory data items4310210196.4 34.297.3 34.697.3 17.397.2 18.8%Teachers recvd.<strong>in</strong>-service tra<strong>in</strong><strong>in</strong>g91Bihar


