

64 Elementary Education in India - Where do we stand ? - DISE
64 Elementary Education in India - Where do we stand ? - DISE
64 Elementary Education in India - Where do we stand ? - DISE

Create successful ePaper yourself
Turn your PDF publications into a flip-book with our unique Google optimized e-Paper software.
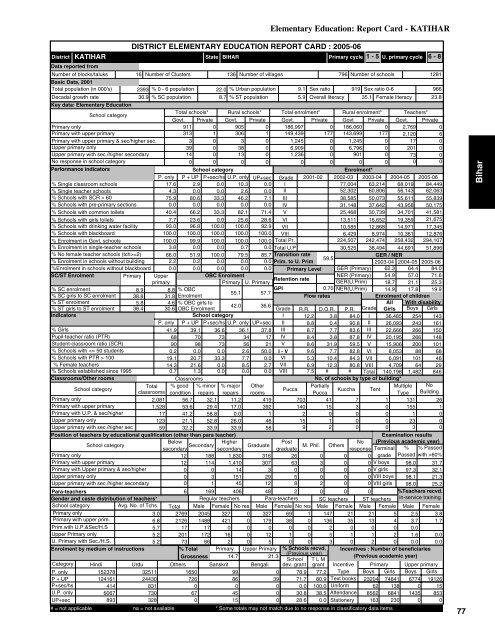
KATIHARDistrictData reported fromNumber of blocks/taluksBasic Data, 2001Total population (<strong>in</strong> 000's)Decadal growth rateDISTRICT ELEMENTARY EDUCATION REPORT CARD : 2005-06StateBIHAR16 Number of Clusters 136 Number of villages796 Number of schools12812393 % 0 - 6 population 22.0 % Urban population 9.1 Sex ratio 919 Sex ratio 0-696630.9 % SC population 8.7 % ST population5.9 Overall literacy 35.1 Female literacy 23.8Primary cycle 1 - 5 U. primary cycle 6 - 8Key data: <strong>Elementary</strong> <strong>Education</strong>School categoryTotal schools* Rural schools* Total enrolment* Rural enrolment* Teachers*Govt. Private Govt. Private Govt. Private Govt Private Govt. PrivatePrimary only911 0 905 0 186,997 0 186,060 0 2,769 0Primary with upper primary313 1 306 1 149,439 177 143,699 177 2,120 6Primary with upper primary & sec/higher sec.3 0 3 0 1,245 0 1,245 0 17 0Upper primary only39 0 38 0 6,909 0 6,796 0 201 0Upper primary with sec./higher secondary14 0 13 0 1,236 0 901 0 73 0No response <strong>in</strong> school category0 0 0 0 0 0 0 0 0 0Performance <strong>in</strong>dicatorsSchool categoryEnrolment*P. only P + UP P+sec/hs U.P. only UP+sec Grade 2001-02 2002-03 2003-04 2004-05 2005-06% S<strong>in</strong>gle classroom schools17.6 2.9 0.0 10.3 0.0 I77,004 63,214 68,019 84,449% S<strong>in</strong>gle teacher schools4.3 0.0 0.0 2.6 0.0 II52,302 60,806 56,143 62,063% Schools with SCR > 6075.9 80.6 33.3 46.2 7.1 III38,585 50,073 55,611 55,839% Schools with pre-primary sections 0.0 0.0 0.0 0.0 0.0 IV31,148 37,<strong>64</strong>2 43,958 50,175% Schools with common toilets 40.4 66.2 33.3 82.1 71.4 V25,468 30,739 34,701 41,581% Schools with girls toilets 7.7 23.6 0.0 25.6 28.6 VI13,511 16,652 19,359 21,675% Schools with dr<strong>in</strong>k<strong>in</strong>g water facility 93.0 96.8 100.0 100.0 92.9 VII10,585 12,868 14,971 17,345% Schools with blackboard100.0 100.0 100.0 100.0 100.0 VIII 6,429 8,974 10,361 12,876% Enrolment <strong>in</strong> Govt. schools 100.0 99.9 100.0 100.0 100.0 Total Pr. 224,507 242,474 258,432 294,107% Enrolment <strong>in</strong> s<strong>in</strong>gle-teacher schools3.8 0.0 0.0 0.7 0.0 Total U.P30,525 38,494 44,691 51,896% No female teacher schools (tch>=2) 66.0 51.9 100.0 79.5 85.7 Transition rateGER / NER59.5% Enrolment <strong>in</strong> schools without build<strong>in</strong>g 2.2 0.2 0.0 0.0 0.0 Prim. to U. Prim2003-04 2004-05 2005-06%Enrolment <strong>in</strong> schools without blackboard 0.0 0.0 0.0 0.0 0.0 Primary Level GER (Primary) 62.3 <strong>64</strong>.4 84.0SC/ST EnrolmentPrimary UpperOBC EnrolmentNER (Primary) 54.9 57.0 71.6Retention rateprimaryPrimary U. PrimaryGER(U.Prim) 18.7 21.1 25.3% SC enrolment8.9 8.8 % OBCGPI0.70 NER(U.Prim) 14.9 17.8 19.955.1 57.7% SC girls to SC enrolment 38.8 31.8 EnrolmentFlow ratesEnrolment of children% ST enrolment5.8 4.6 % OBC girls toAll With disability42.0 36.6% ST girls to ST enrolment 38.4 30.6 OBC EnrolmentGrade R.R. D.O.R. P.R. Grade Girls Boys GirlsIndicatorsSchool categoryI 12.2 3.8 84.0 I 36,485 254 143P. only P + UP P+sec/hs U.P. only UP+sec II 8.8 0.4 90.8 II 26,093 243 161% Girls41.9 39.1 36.6 36.1 37.8 III 8.7 7.7 83.6 III 22,666 266 150Pupil-teacher ratio (PTR)68 70 73 34 17 IV 8.4 3.8 87.8 IV 20,195 266 148Student-classroom ratio (SCR)90 98 73 56 21 V 8.6 31.9 59.5 V 15,906 200 101% Schools with 10019.1 20.7 33.3 7.7 0.0 VI 5.3 10.4 84.3 VII 6,091 101 46% Female teachers14.3 21.6 0.0 8.5 2.7 VII 6.9 12.3 80.8 VIII 4,709 <strong>64</strong> 29% Schools established s<strong>in</strong>ce 19950.7 1.3 0.0 0.0 0.0 VIII 7.5 # # Total 140,198 1,482 846Classrooms/Other roomsClassroomsNo. of schools by type of build<strong>in</strong>g*School categoryTotal % good % m<strong>in</strong>or % major OtherPartiallyMultiple NoPuccaKuccha Tentclassrooms condition repairs repairs roomsPuccaType Build<strong>in</strong>gPrimary only2,081 56.7 32.1 11.2 419 703 41 7 1 131 26Primary with upper primary1,528 53.6 29.4 17.0 392 140 15 3 0 155 1Primary with U.P. & sec/higher17 41.2 58.8 0.012 0 0 0 1 0Upper primary only123 21.1 52.8 26.0 4615 1 0 0 23 0Upper primary with sec./higher sec59 32.2 33.9 33.9 589 2 0 0 3 0Position of teachers by educational qualification (other than para teacher)Exam<strong>in</strong>ation resultsSchool category BelowHigherPost(Previous academic year)M. Phil.secondarysecondarygraduateNoresponse Term<strong>in</strong>al % % Passed12 188 1,830 316 26 0 0 0 grade Passed with >60%V boysPrimary onlyPrimary with upper primaryPrimary with Upper primary & sec/higherUpper primary onlyUpper primary with sec./higher secondaryPara-teachersGender and caste distribution of teachers*School categoryAvg. No. of Tchs.Primary only3.0 2769 2045Primary with upper prim.6.8 2126 1488 421 0 179Prim.with U.P.&Sec/H.S5.7 17 17 0 0 0Upper Primary only5.2 201 172 16 0 12U. Primary with Sec./H.S.5.2 73 66 2 0 5Enrolment by medium of <strong>in</strong>structions% Total Primary Upper PrimaryGrossness 14.7 21.3Category H<strong>in</strong>di Urdu Others Sanskrit BengaliP. only152378325111650990P + UP124161244307268639P+sec/hs414831000U.P. only606773067450UP+sec8933280150<strong>Elementary</strong> <strong>Education</strong>: Report Card - KATIHAR12 114 1,410 307 63 3 0 00 0 14 3 0 0 0 0 V girls0 3 151 29 5 0 0 0 VIII boys0 1 45 12 8 2 0 0 VIII girls6 169 406 48 2 0 0 0Regular teachers Para-teachers SC teachers ST teachersTotal Male Female No res Male Female No res Male Female Male Female327 0 327 69 1 147 21 21 53801000136253501130140298.0 25.2%Teachers recvd.<strong>in</strong>-service tra<strong>in</strong><strong>in</strong>gMale Female2.5 3.83.7 1.70.01.60.00.00 0 3 0 2 0 0.0% Schools recvd. Incentives : Number of beneficiaries(Previous year)(Previous academic year)School T L Mdev. grant grant Incentive Primary Upper primary78.9 77.2 Type Boys Girls Boys Girls71.7 80.9 Text books 23204 74841 6774 191260.0 100.0 Uniform 62 138 0 1530.8 38.5 Attendance 8562 6841 1435 85328.6 0.0 Stationery 163 230 0 0# = not applicable na = not available * Some totals may not match due to no response <strong>in</strong> classificatory data items98.0 31.797.3 32.198.1 21.377Bihar


