64 Elementary Education in India - Where do we stand ? - DISE
64 Elementary Education in India - Where do we stand ? - DISE
64 Elementary Education in India - Where do we stand ? - DISE
You also want an ePaper? Increase the reach of your titles
YUMPU automatically turns print PDFs into web optimized ePapers that Google loves.
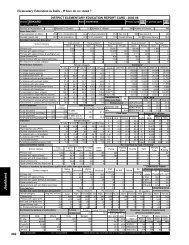
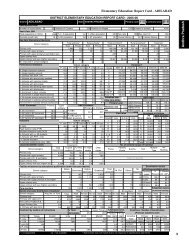
Bihar76<strong>Elementary</strong> <strong>Education</strong> <strong>in</strong> <strong>India</strong> - <strong>Where</strong> <strong>do</strong> <strong>we</strong> <strong>stand</strong> ?DISTRICT ELEMENTARY EDUCATION REPORT CARD : 2005-06KAIMUR (BHABUA)State BIHARDistrictData reported fromNumber of blocks/taluksBasic Data, 2001Total population (<strong>in</strong> 000's)Decadal growth rate11 Number of Clusters 72 Number of villages845 Number of schools9551289 % 0 - 6 population 20.9 % Urban population 3.2 Sex ratio 902 Sex ratio 0-694030.6 % SC population 22.2 % ST population2.8 Overall literacy 55.1 Female literacy 38.8Primary cycle 1 - 5 U. primary cycle 6 - 8Key data: <strong>Elementary</strong> <strong>Education</strong>School categoryTotal schools* Rural schools* Total enrolment* Rural enrolment* Teachers*Govt. Private Govt. Private Govt. Private Govt Private Govt. PrivatePrimary only621 0 611 0 123,374 0 121,<strong>64</strong>3 0 2,320 0Primary with upper primary287 0 281 0 153,722 0 149,007 0 2,090 0Primary with upper primary & sec/higher sec.0 0 0 0 0 0 0 0 0 0Upper primary only2 0 2 0 255 0 255 0 9 0Upper primary with sec./higher secondary45 0 41 0 8,177 0 7,421 0 272 0No response <strong>in</strong> school category0 0 0 0 0 0 0 0 0 0Performance <strong>in</strong>dicatorsSchool categoryEnrolment*P. only P + UP P+sec/hs U.P. only UP+sec Grade 2001-02 2002-03 2003-04 2004-05 2005-06% S<strong>in</strong>gle classroom schools6.3 2.1 0.0 0.0 2.2 I70,196 61,765 67,497 56,706% S<strong>in</strong>gle teacher schools2.3 1.0 0.0 0.0 4.4 II38,566 42,429 50,686 51,686% Schools with SCR > 6067.3 87.5 0.0 50.0 17.8 III31,546 33,395 42,113 46,059% Schools with pre-primary sections 21.1 15.3 0.0 0.0 6.7 IV24,796 27,409 33,951 37,913% Schools with common toilets 23.0 61.7 0.0 50.0 37.8 V19,638 21,816 28,532 31,752% Schools with girls toilets 6.3 47.0 0.0 50.0 31.1 VI11,412 13,689 19,625 24,013% Schools with dr<strong>in</strong>k<strong>in</strong>g water facility 92.8 94.8 0.0 100.0 95.6 VII9,411 10,798 16,269 19,780% Schools with blackboard92.3 93.7 0.0 100.0 80.0 VIII 7,883 8,611 13,253 17,619% Enrolment <strong>in</strong> Govt. schools 100.0 100.0 0.0 100.0 100.0 Total Pr. 184,742 186,814 222,779 224,116% Enrolment <strong>in</strong> s<strong>in</strong>gle-teacher schools1.3 0.8 0.0 0.0 0.3 Total U.P28,706 33,098 49,147 61,412% No female teacher schools (tch>=2) 27.5 16.7 0.0 100.0 71.1 Transition rateGER / NER78.8% Enrolment <strong>in</strong> schools without build<strong>in</strong>g 0.8 0.0 0.0 0.0 0.0 Prim. to U. Prim2003-04 2004-05 2005-06%Enrolment <strong>in</strong> schools without blackboard 6.2 4.5 0.0 0.0 21.4 Primary Level GER (Primary) 89.2 103.2 118.7SC/ST EnrolmentPrimary UpperOBC EnrolmentNER (Primary) 86.2100.0Retention rateprimaryPrimary U. PrimaryGER(U.Prim) 29.9 43.0 55.6% SC enrolment24.2 21.1 % OBCGPI0.87 NER(U.Prim) 28.6 40.5 51.356.7 51.7% SC girls to SC enrolment 44.2 34.8 EnrolmentFlow ratesEnrolment of children% ST enrolment3.3 1.7 % OBC girls toAll With disability47.1 39.8% ST girls to ST enrolment 44.3 38.0 OBC EnrolmentGrade R.R. D.O.R. P.R. Grade Girls Boys GirlsIndicatorsSchool categoryI 34.1 5.3 60.6 I 27,092 296 183P. only P + UP P+sec/hs U.P. only UP+sec II 21.3 1.8 76.9 II 24,363 305 197% Girls47.4 43.7 0.0 41.2 29.3 III 16.8 3.7 79.5 III 21,377 307 259Pupil-teacher ratio (PTR)53 74 0 28 30 IV 13.1 2.2 84.7 IV 17,323 299 203Student-classroom ratio (SCR)79 109 0 <strong>64</strong> 29 V 10.5 10.8 78.8 V 13,844 301 165% Schools with 1005.0 15.0 0.0 0.0 4.4 VI 7.9VII 7,633 1<strong>64</strong> 72% Female teachers31.3 29.5 0.0 0.0 4.4 VII 5.6VIII 6,668 107 44% Schools established s<strong>in</strong>ce 19957.6 0.0 0.0 0.0 2.2 VIII 4.6 # # Total 128,110 1,957 1,250Classrooms/Other roomsClassroomsNo. of schools by type of build<strong>in</strong>g*School categoryTotal % good % m<strong>in</strong>or % major OtherPartiallyMultiple NoPuccaKuccha Tentclassrooms condition repairs repairs roomsPuccaType Build<strong>in</strong>gPrimary only1,561 67.4 24.6 7.9 408 593 6 0 0 16 6Primary with upper primary1,416 75.4 17.1 7.5 387 262 2 0 0 23 0Primary with U.P. & sec/higher0 0.0 0.0 0.000 0 0 0 0 0Upper primary only4 75.0 25.0 0.012 0 0 0 0 0Upper primary with sec./higher sec 282 74.8 17.4 7.8 21840 0 0 0 5 0Position of teachers by educational qualification (other than para teacher)Exam<strong>in</strong>ation resultsSchool category BelowHigherPost(Previous academic year)M. Phil.secondarysecondarygraduateNoresponse Term<strong>in</strong>al % % Passed13 274 186 215 94 3 0 5 grade Passed with >60%V boysPrimary onlyPrimary with upper primaryPrimary with Upper primary & sec/higherUpper primary onlyUpper primary with sec./higher secondaryPara-teachersGender and caste distribution of teachers*School categoryAvg. No. of Tchs.Primary only3.7 2320 661Primary with upper prim.7.3 2090 776 122 0 698Prim.with U.P.&Sec/H.S0.0 0 0 0 0 0Upper Primary only4.5 9 4 0 0 5U. Primary with Sec./H.S.6.0 272 257 12 0 3Enrolment by medium of <strong>in</strong>structions% Total Primary Upper PrimaryGrossness 5.0 7.7Category H<strong>in</strong>di Urdu Others SanskritP. only116918518312700P + UP149145204421400P+sec/hs0000U.P. only1<strong>64</strong>9100UP+sec78610284324 167 151 297 272 6 1 00 0 0 0 0 0 0 0 V girls0 1 2 1 0 0 0 0 VIII boys2 0 6 104 133 23 0 1 VIII girls18 134 1,011 1,189 338 6 3 0Regular teachers Para-teachers SC teachers ST teachersTotal Male Female No res Male Female No res Male Female Male Female129 0 932 598 0 385 126 43 1149400000297009200Male Female68.0 55.061.7 45.60.0 0.033.30 0 24 0 1 0 8.5 0.0% Schools recvd. Incentives : Number of beneficiaries(Previous year)(Previous academic year)School T L Mdev. grant grant Incentive Primary Upper primary88.6 78.7 Type Boys Girls Boys Girls93.0 87.8 Text books 36504 48545 12558 160070.0 0.0 Uniform 361 117 569 51100.0 100.0 Attendance 5717 4667 291 21948.9 31.1 Stationery 306 0 614 30# = not applicable na = not available * Some totals may not match due to no response <strong>in</strong> classificatory data items3000100099.1 35.298.9 35.597.5 11.698.7 11.6%Teachers recvd.<strong>in</strong>-service tra<strong>in</strong><strong>in</strong>g


