64 Elementary Education in India - Where do we stand ? - DISE
64 Elementary Education in India - Where do we stand ? - DISE
64 Elementary Education in India - Where do we stand ? - DISE
Create successful ePaper yourself
Turn your PDF publications into a flip-book with our unique Google optimized e-Paper software.
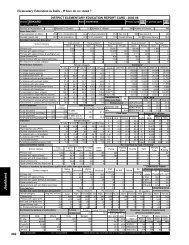
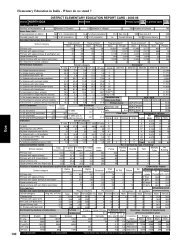
Bihar92<strong>Elementary</strong> <strong>Education</strong> <strong>in</strong> <strong>India</strong> - <strong>Where</strong> <strong>do</strong> <strong>we</strong> <strong>stand</strong> ?SAHARSADistrictData reported fromNumber of blocks/taluksBasic Data, 2001Total population (<strong>in</strong> 000's)Decadal growth rateDISTRICT ELEMENTARY EDUCATION REPORT CARD : 2005-06State10 Number of Clusters 111 Number of villages433 Number of schools8081508 % 0 - 6 population 21.0 % Urban population 8.3 Sex ratio 910 Sex ratio 0-691233.0 % SC population 16.1 % ST population0.3 Overall literacy 39.1 Female literacy 25.3Primary cycle 1 - 5 U. primary cycle 6 - 8Key data: <strong>Elementary</strong> <strong>Education</strong>School categoryTotal schools* Rural schools* Total enrolment* Rural enrolment* Teachers*Govt. Private Govt. Private Govt. Private Govt Private Govt. PrivatePrimary only532 0 515 0 112,531 0 109,573 0 2,037 0Primary with upper primary217 2 198 2 93,223 0 83,449 0 1,537 0Primary with upper primary & sec/higher sec.25 4 22 4 6,278 810 5,192 810 103 29Upper primary only8 1 8 1 1,526 30 1,526 30 41 9Upper primary with sec./higher secondary18 1 17 1 1,417 0 1,070 0 <strong>64</strong> 0No response <strong>in</strong> school category0 0 0 0 0 0 0 0 0 0Performance <strong>in</strong>dicatorsSchool categoryEnrolment*P. only P + UP P+sec/hs U.P. only UP+sec Grade 2001-02 2002-03 2003-04 2004-05 2005-06% S<strong>in</strong>gle classroom schools5.5 2.3 3.4 11.1 5.3 I65,594 60,185 58,067 59,913% S<strong>in</strong>gle teacher schools4.7 0.5 0.0 0.0 15.8 II40,401 42,544 39,805 38,431% Schools with SCR > 6073.7 80.8 44.8 44.4 0.0 III26,807 34,062 34,602 34,146% Schools with pre-primary sections 12.4 11.0 6.9 11.1 5.3 IV19,866 24,026 28,465 29,202% Schools with common toilets 22.2 56.6 37.9 22.2 47.4 V16,107 19,549 21,425 25,237% Schools with girls toilets 3.6 17.8 10.3 0.0 36.8 VI9,181 10,304 11,639 12,865% Schools with dr<strong>in</strong>k<strong>in</strong>g water facility 87.8 88.1 55.2 66.7 63.2 VII6,822 8,162 9,052 10,087% Schools with blackboard85.2 88.6 48.3 66.7 42.1 VIII 3,237 4,429 4,876 5,934% Enrolment <strong>in</strong> Govt. schools 100.0 100.0 88.6 98.1 100.0 Total Pr. 168,775 180,366 182,3<strong>64</strong> 186,929% Enrolment <strong>in</strong> s<strong>in</strong>gle-teacher schools3.9 0.4 0.0 0.0 17.7 Total U.P19,240 22,895 25,567 28,886% No female teacher schools (tch>=2) 35.2 25.1 27.6 55.6 36.8 Transition rateGER / NER57.2% Enrolment <strong>in</strong> schools without build<strong>in</strong>g 6.8 3.0 0.0 0.0 0.0 Prim. to U. Prim2003-04 2004-05 2005-06%Enrolment <strong>in</strong> schools without blackboard 14.4 9.1 20.4 16.8 51.5 Primary Level GER (Primary) 73.3 71.7 84.7SC/ST EnrolmentPrimary UpperOBC EnrolmentNER (Primary) 71.7 62.6 73.3Retention rateprimaryPrimary U. PrimaryGER(U.Prim) 17.6 19.0 22.4% SC enrolment14.1 7.6 % OBCGPI0.60 NER(U.Prim) 16.9 15.9 19.366.0 62.7% SC girls to SC enrolment 33.1 22.6 EnrolmentFlow ratesEnrolment of children% ST enrolment0.718 0.765 % OBC girls toAll With disability36.4 26.2% ST girls to ST enrolment 36.9 20.8 OBC EnrolmentGrade R.R. D.O.R. P.R. Grade Girls Boys GirlsIndicatorsSchool categoryI 31.1 11.7 57.2 I 24,133 241 108P. only P + UP P+sec/hs U.P. only UP+sec II 13.2 9.4 77.4 II 14,907 171 102% Girls38.3 34.3 39.6 28.6 29.9 III 9.6 12.3 78.1 III 12,460 184 88Pupil-teacher ratio (PTR)55 61 54 31 22 IV 7.7 9.4 82.9 IV 10,398 155 83Student-classroom ratio (SCR)99 103 68 62 24 V 7.7 35.2 57.2 V 8,384 1<strong>64</strong> 77% Schools with 10011.5 11.9 0.0 0.0 5.3 VI 5.3 11.7 83.0 VII 2,862 58 13% Female teachers27.0 28.9 25.8 12.0 4.7 VII 4.7 32.7 62.6 VIII 1,913 22 4% Schools established s<strong>in</strong>ce 19950.0 0.0 0.0 0.0 0.0 VIII 5.4 # # Total 78,828 1,060 499Classrooms/Other roomsClassroomsNo. of schools by type of build<strong>in</strong>g*School categoryTotal % good % m<strong>in</strong>or % major OtherPartiallyMultiple NoPuccaKuccha Tentclassrooms condition repairs repairs roomsPuccaType Build<strong>in</strong>gPrimary only1,135 44.1 35.4 20.5 261 408 33 7 0 40 43Primary with upper primary902 43.8 30.2 26.1 229 130 10 0 0 67 12Primary with U.P. & sec/higher104 38.5 27.9 33.7 298 1 0 0 10 10Upper primary only25 40.0 16.0 44.0 104 2 1 0 2 0Upper primary with sec./higher sec60 28.3 26.7 45.0 6612 0 0 0 3 4Position of teachers by educational qualification (other than para teacher)Exam<strong>in</strong>ation resultsSchool category BelowHigherPost(Previous academic year)M. Phil.secondarysecondarygraduateNoresponse Term<strong>in</strong>al % % Passed9 350 202 329 157 3 3 33 grade Passed with >60%V boysPrimary onlyPrimary with upper primaryPrimary with Upper primary & sec/higher6 191 147 359 313 3 1 1397.3 30.62 10 23 24 43 0 1 2 V girls 97.4 34.2Upper primary only0 11 4 12 13 0 0 1 VIII boys 98.4 18.3Upper primary with sec./higher secondary0 0 0 27 35 0 0 2 VIII girls 98.6 20.4Para-teachers3 139 812 313 66 2 2 0%Teachers recvd.Gender and caste distribution of teachers*Regular teachers Para-teachers SC teachers ST teachers <strong>in</strong>-service tra<strong>in</strong><strong>in</strong>gSchool categoryAvg. No. of Tchs. Total Male Female No res Male Female No res Male Female Male Female Male FemalePrimary only3.8 2037 893 193 0 593 358 0 218 54 21 3 58.8 48.6Primary with upper prim.7.0 1537 804 229 0 289 215 0 96 46 2 3 55.4 50.9Prim.with U.P.&Sec/H.S4.6 132 86 19 0 12 15 0 5 2 0 1 45.9 58.8Upper Primary only5.6 50 36 5 0 8 1 0 1 0 1 0 34.1 50.0U. Primary with Sec./H.S.3.4 <strong>64</strong> 61 3 0 0 0 0 2 1 0 0 0.0 0.0Enrolment by medium of <strong>in</strong>structions% Total Primary Upper Primary % Schools recvd. Incentives : Number of beneficiaries(Previous year)Grossness 13.4 13.6(Previous academic year)School T L MCategory H<strong>in</strong>di Urdu Others Bengali Konkani dev. grant grantPrimary Upper primary100562Boys Girls Boys GirlsP. onlyP + UPP+sec/hsU.P. onlyUP+sec8662551831353128110159539819050291133750014697BIHAR0214000129000092.186.841.455.60.089.386.341.455.60.0IncentiveTypeText booksUniformAttendanceStationery# = not applicable na = not available * Some totals may not match due to no response <strong>in</strong> classificatory data items21265607<strong>64</strong>8133501422045584117208200256845006


