

64 Elementary Education in India - Where do we stand ? - DISE
64 Elementary Education in India - Where do we stand ? - DISE
64 Elementary Education in India - Where do we stand ? - DISE

Create successful ePaper yourself
Turn your PDF publications into a flip-book with our unique Google optimized e-Paper software.
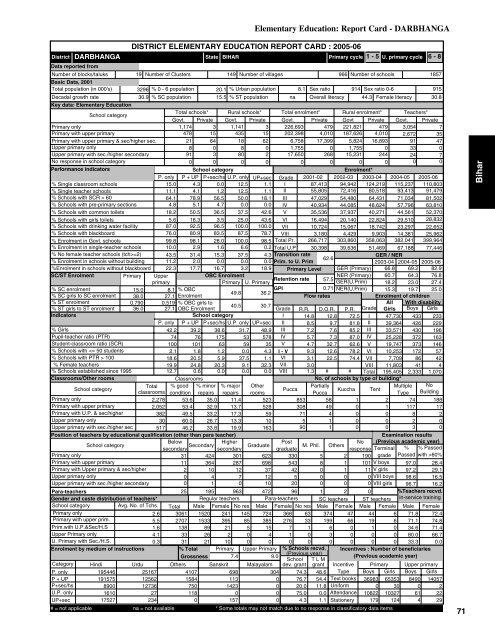
DARBHANGADistrictData reported fromNumber of blocks/taluksBasic Data, 2001Total population (<strong>in</strong> 000's)Decadal growth rateDISTRICT ELEMENTARY EDUCATION REPORT CARD : 2005-06StateBIHAR19 Number of Clusters 149 Number of villages966 Number of schools18573296 % 0 - 6 population 20.1 % Urban population 8.1 Sex ratio 914 Sex ratio 0-691530.9 % SC population 15.5 % ST population na Overall literacy 44.3 Female literacy 30.8Primary cycle 1 - 5 U. primary cycle 6 - 8Key data: <strong>Elementary</strong> <strong>Education</strong>School categoryTotal schools* Rural schools* Total enrolment* Rural enrolment* Teachers*Govt. Private Govt. Private Govt. Private Govt Private Govt. PrivatePrimary only1,174 3 1,141 3 226,693 479 221,821 479 3,054 7Primary with upper primary478 15 435 15 202,398 4,010 187,626 4,010 2,672 35Primary with upper primary & sec/higher sec.21 <strong>64</strong> 18 62 6,758 17,399 5,824 16,893 91 47Upper primary only8 0 8 0 1,755 0 1,755 0 33 0Upper primary with sec./higher secondary91 3 80 2 17,650 268 15,231 244 24 7No response <strong>in</strong> school category0 0 0 0 0 0 0 0 0 0Performance <strong>in</strong>dicatorsSchool categoryEnrolment*P. only P + UP P+sec/hs U.P. only UP+sec Grade 2001-02 2002-03 2003-04 2004-05 2005-06% S<strong>in</strong>gle classroom schools15.0 4.3 0.0 12.5 1.1 I 87,413 94,942 124,219 115,237 110,803% S<strong>in</strong>gle teacher schools11.1 4.1 1.2 12.5 1.1 II 55,805 72,416 80,518 93,413 91,479% Schools with SCR > 60<strong>64</strong>.1 78.9 56.5 50.0 18.1 III 47,029 54,480 <strong>64</strong>,431 71,034 81,502% Schools with pre-primary sections 4.8 5.1 4.7 0.0 0.0 IV 40,934 44,085 48,624 57,796 63,810% Schools with common toilets 18.2 50.5 36.5 37.5 42.6 V 35,536 37,937 40,271 44,561 52,370% Schools with girls toilets 5.6 18.3 3.5 25.0 43.6 VI 16,494 20,140 22,824 29,510 28,832% Schools with dr<strong>in</strong>k<strong>in</strong>g water facility 87.0 92.5 96.5 100.0 100.0 VII 10,724 15,067 18,742 23,297 22,652% Schools with blackboard76.0 80.9 83.5 87.5 78.7 VIII 3,180 4,429 9,903 14,381 25,962% Enrolment <strong>in</strong> Govt. schools 99.8 98.1 28.0 100.0 98.5 Total Pr. 266,717 303,860 358,063 382,041 399,9<strong>64</strong>% Enrolment <strong>in</strong> s<strong>in</strong>gle-teacher schools 10.0 2.9 1.6 6.6 0.2 Total U.P 30,398 39,636 51,469 67,188 77,446% No female teacher schools (tch>=2) 43.5 31.4 15.3 37.5 4.3 Transition rateGER / NER62.6% Enrolment <strong>in</strong> schools without build<strong>in</strong>g 11.2 2.0 0.0 0.0 0.0 Prim. to U. Prim2003-04 2004-05 2005-06%Enrolment <strong>in</strong> schools without blackboard 22.3 17.7 16.7 3.2 18.9 Primary Level GER (Primary) 66.8 69.2 82.9SC/ST EnrolmentPrimary UpperOBC EnrolmentNER (Primary) 60.7 <strong>64</strong>.3 76.8Retention rate 57.5primaryPrimary U. PrimaryGER(U.Prim) 18.2 23.0 27.4% SC enrolment15.0 8.1 % OBCGPI0.71 NER(U.Prim) 15.3 19.7 25.049.8 36.2% SC girls to SC enrolment 38.0 27.1 EnrolmentFlow ratesEnrolment of children% ST enrolment0.790 0.519 % OBC girls toAll With disability40.5 30.7% ST girls to ST enrolment 36.0 27.1 OBC EnrolmentGrade R.R. D.O.R. P.R. Grade Girls Boys GirlsIndicatorsSchool categoryI 14.8 12.8 72.5 I 47,730 433 233P. only P + UP P+sec/hs U.P. only UP+sec II 8.5 9.7 81.8 II 39,3<strong>64</strong> 426 229% Girls42.2 39.2 38.6 31.7 48.9 III 7.2 7.6 85.2 III 33,571 430 196Pupil-teacher ratio (PTR)74 76 175 53 578 IV 5.7 7.3 87.0 IV 25,228 372 163Student-classroom ratio (SCR)100 101 63 59 35 V 4.7 32.7 62.6 V 19,747 373 146% Schools with 10018.6 20.5 5.9 37.5 1.1 VI 3.1 22.5 74.4 VII 7,709 86 42% Female teachers19.9 24.8 20.3 9.1 32.3 VII 3.0VIII 11,803 41 4% Schools established s<strong>in</strong>ce 199512.7 0.6 0.0 0.0 0.0 VIII 1.3 # # Total 195,405 2,333 1,070Classrooms/Other roomsClassroomsNo. of schools by type of build<strong>in</strong>g*School categoryTotal % good % m<strong>in</strong>or % major OtherPartiallyMultiple NoPuccaKuccha Tentclassrooms condition repairs repairs roomsPuccaType Build<strong>in</strong>gPrimary only2,278 53.6 35.0 11.4 523 853 58 1 2 74 188Primary with upper primary2,052 53.4 32.9 13.7 528 308 49 0 1 117 17Primary with U.P. & sec/higher382 49.5 33.2 17.3 5971 4 0 0 8 2Upper primary only30 60.0 26.7 13.3 105 1 0 0 2 0Upper primary with sec./higher sec 517 46.2 33.8 19.9 16390 1 0 0 3 0Position of teachers by educational qualification (other than para teacher)Exam<strong>in</strong>ation resultsSchool category BelowHigherPost(Previous academic year)M. Phil.secondarysecondarygraduateNoresponse Term<strong>in</strong>al % % Passed31 424 301 623 330 5 2 190 grade Passed with >60%V boysPrimary onlyPrimary with upper primaryPrimary with Upper primary & sec/higherUpper primary onlyUpper primary with sec./higher secondaryPara-teachersGender and caste distribution of teachers*School categoryAvg. No. of Tchs.Primary only2.6 3061 1520Primary with upper prim.5.5 2707 1533 395 85 385Prim.with U.P.&Sec/H.S1.6 138 89 21 5 15Upper Primary only4.1 33 26 2 0 4U. Primary with Sec./H.S.0.3 31 21 10 0 0Enrolment by medium of <strong>in</strong>structions% Total Primary Upper PrimaryGrossness 7.4 9.0Category H<strong>in</strong>di Urdu Others Sanskrit MalayalamP. only195446251674107698304P + UP1915751256215841130P+sec/hs89001273675014230U.P. only16102711800UP+sec1752723401570<strong>Elementary</strong> <strong>Education</strong>: Report Card - DARBHANGA11 3<strong>64</strong> 287 698 543 8 1 1012 10 12 37 42 0 1 11 V girls0 4 7 12 5 0 0 0 VIII boys0 1 0 10 20 0 0 0 VIII girls25 185 963 472 96 1 2 0Regular teachers Para-teachers SC teachers ST teachersTotal Male Female No res Male Female No res Male Female Male Female241 145 724 368 63 374 47 44 6276713310199636600Male Female71.8 72.471.1 74.834.6 71.480.0 66.70 0 0 0 0 0 33.3 0.0% Schools recvd. Incentives : Number of beneficiaries(Previous year)(Previous academic year)School T L Mdev. grant grant Incentive Primary Upper primary74.3 48.6 Type Boys Girls Boys Girls76.7 54.4 Text books 36983 65353 8490 1405720.0 11.8 Uniform0 30 0 275.0 0.0 Attendance 10822 10327 61 224.3 1.1 Stationery 179 124 4 29# = not applicable na = not available * Some totals may not match due to no response <strong>in</strong> classificatory data items191060097.0 28.497.2 29.198.6 16.596.7 16.2%Teachers recvd.<strong>in</strong>-service tra<strong>in</strong><strong>in</strong>g71Bihar


