

64 Elementary Education in India - Where do we stand ? - DISE
64 Elementary Education in India - Where do we stand ? - DISE
64 Elementary Education in India - Where do we stand ? - DISE

Create successful ePaper yourself
Turn your PDF publications into a flip-book with our unique Google optimized e-Paper software.
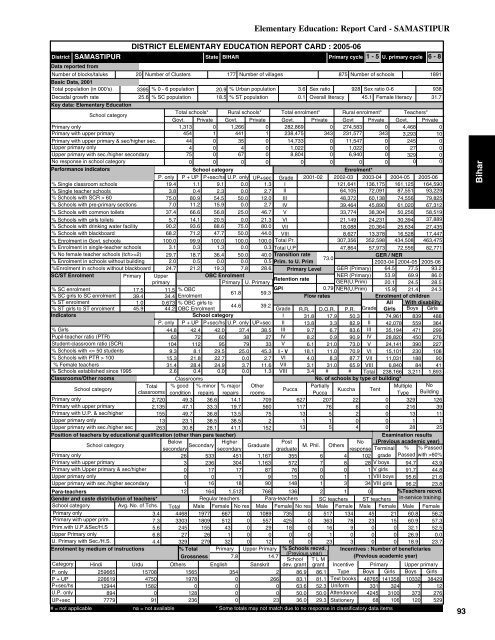
SAMASTIPURDistrictData reported fromNumber of blocks/taluksBasic Data, 2001Total population (<strong>in</strong> 000's)Decadal growth rateDISTRICT ELEMENTARY EDUCATION REPORT CARD : 2005-06StateBIHAR20 Number of Clusters 177 Number of villages875 Number of schools18913395 % 0 - 6 population 20.9 % Urban population 3.6 Sex ratio 928 Sex ratio 0-693825.6 % SC population 18.5 % ST population0.1 Overall literacy 45.1 Female literacy 31.7Primary cycle 1 - 5 U. primary cycle 6 - 8Key data: <strong>Elementary</strong> <strong>Education</strong>School categoryTotal schools* Rural schools* Total enrolment* Rural enrolment* Teachers*Govt. Private Govt. Private Govt. Private Govt Private Govt. PrivatePrimary only1,313 0 1,266 0 282,869 0 274,583 0 4,468 0Primary with upper primary454 1 441 1 238,475 343 231,577 343 3,293 10Primary with upper primary & sec/higher sec.44 0 35 0 14,733 0 11,547 0 245 0Upper primary only4 0 4 0 1,022 0 1,022 0 27 0Upper primary with sec./higher secondary75 0 67 0 8,804 0 6,940 0 329 0No response <strong>in</strong> school category0 0 0 0 0 0 0 0 0 0Performance <strong>in</strong>dicatorsSchool categoryEnrolment*P. only P + UP P+sec/hs U.P. only UP+sec Grade 2001-02 2002-03 2003-04 2004-05 2005-06% S<strong>in</strong>gle classroom schools19.4 1.1 9.1 0.0 1.3 I121,<strong>64</strong>1 136,175 161,125 1<strong>64</strong>,590% S<strong>in</strong>gle teacher schools3.8 0.4 2.3 0.0 2.7 II<strong>64</strong>,105 72,091 87,551 93,229% Schools with SCR > 6075.0 80.9 54.5 50.0 12.0 III48,372 60,138 74,556 79,825% Schools with pre-primary sections 7.0 11.2 15.9 0.0 2.7 IV39,4<strong>64</strong> 45,890 61,020 67,312% Schools with common toilets 37.4 66.6 56.8 25.0 46.7 V33,774 38,304 50,256 58,519% Schools with girls toilets 5.7 14.1 20.5 0.0 21.3 VI21,149 24,231 30,394 37,889% Schools with dr<strong>in</strong>k<strong>in</strong>g water facility 90.2 93.6 88.6 75.0 80.0 VII18,088 20,3<strong>64</strong> 25,634 27,435% Schools with blackboard68.2 71.2 47.7 50.0 44.0 VIII 8,627 13,378 16,528 17,447% Enrolment <strong>in</strong> Govt. schools 100.0 99.9 100.0 100.0 100.0 Total Pr. 307,356 352,598 434,508 463,475% Enrolment <strong>in</strong> s<strong>in</strong>gle-teacher schools3.1 0.3 1.3 0.0 0.3 Total U.P47,8<strong>64</strong> 57,973 72,556 82,771% No female teacher schools (tch>=2) 29.7 18.7 36.4 50.0 40.0 Transition rateGER / NER73.0% Enrolment <strong>in</strong> schools without build<strong>in</strong>g 2.0 0.5 0.0 0.0 0.5 Prim. to U. Prim2003-04 2004-05 2005-06%Enrolment <strong>in</strong> schools without blackboard 24.7 21.2 19.3 7.8 28.6 Primary Level GER (Primary) <strong>64</strong>.5 77.5 93.2SC/ST EnrolmentPrimary UpperOBC EnrolmentNER (Primary) 53.9 69.9 86.0Retention rateprimaryPrimary U. PrimaryGER(U.Prim) 20.1 24.5 28.5% SC enrolment17.5 11.5 % OBCGPI0.79 NER(U.Prim) 15.9 21.4 24.361.8 59.3% SC girls to SC enrolment 39.4 34.4 EnrolmentFlow ratesEnrolment of children% ST enrolment1.0 0.673 % OBC girls toAll With disability44.6 39.2% ST girls to ST enrolment 45.9 44.2 OBC EnrolmentGrade R.R. D.O.R. P.R. Grade Girls Boys GirlsIndicatorsSchool categoryI 31.8 17.9 50.3 I 74,961 839 488P. only P + UP P+sec/hs U.P. only UP+sec II 13.8 3.3 82.9 II 42,078 559 3<strong>64</strong>% Girls44.8 42.4 42.0 37.4 38.5 III 9.7 6.7 83.6 III 35,194 471 299Pupil-teacher ratio (PTR)63 72 60 38 27 IV 8.2 0.9 90.9 IV 28,820 450 276Student-classroom ratio (SCR)104 112 95 79 33 V 6.1 21.0 73.0 V 24,141 390 227% Schools with 10015.3 21.8 22.7 0.0 2.7 VI 4.0 8.3 87.7 VII 11,031 188 90% Female teachers31.4 28.4 24.9 3.7 11.6 VII 3.1 31.0 65.9 VIII 6,840 84 41% Schools established s<strong>in</strong>ce 19952.6 0.4 0.0 0.0 1.3 VIII 3.4 # # Total 238,166 3,211 1,893Classrooms/Other roomsClassroomsNo. of schools by type of build<strong>in</strong>g*School categoryTotal % good % m<strong>in</strong>or % major OtherPartiallyMultiple NoPuccaKuccha Tentclassrooms condition repairs repairs roomsPuccaType Build<strong>in</strong>gPrimary only2,720 49.3 36.6 14.1 709 627 207 22 0 329 126Primary with upper primary2,135 47.1 33.3 19.7 560 117 76 6 0 216 39Primary with U.P. & sec/higher155 49.7 36.8 13.5 7513 5 2 0 13 11Upper primary only13 23.1 38.5 38.521 1 0 0 1 1Upper primary with sec./higher sec 263 30.8 28.1 41.1 15213 5 4 0 28 25Position of teachers by educational qualification (other than para teacher)Exam<strong>in</strong>ation resultsSchool category BelowHigherPost(Previous academic year)M. Phil.secondarysecondarygraduateNoresponse Term<strong>in</strong>al % % Passed26 533 451 1,167 355 6 4 102 grade Passed with >60%V boysPrimary onlyPrimary with upper primaryPrimary with Upper primary & sec/higherUpper primary onlyUpper primary with sec./higher secondaryPara-teachersGender and caste distribution of teachers*School categoryAvg. No. of Tchs.Primary only3.4 4468 1977Primary with upper prim.7.3 3303 1809 512 0 557Prim.with U.P.&Sec/H.S5.6 245 155 43 0 29Upper Primary only6.8 27 26 1 0 0U. Primary with Sec./H.S.4.4 329 279 32 0 12Enrolment by medium of <strong>in</strong>structions% Total Primary Upper PrimaryGrossness 7.8 14.7Category H<strong>in</strong>di Urdu Others English SanskritP. only2596651570815653542P + UP226619475019780266P+sec/hs129441582000U.P. only894012800UP+sec777991236023<strong>Elementary</strong> <strong>Education</strong>: Report Card - SAMASTIPUR3 236 304 1,163 572 7 8 280 17 17 87 76 0 0 1 V girls0 0 1 9 15 0 1 1 VIII boys1 16 18 90 148 1 3 34 VIII girls12 1<strong>64</strong> 1,512 768 136 2 1 0Regular teachers Para-teachers SC teachers ST teachersTotal Male Female No res Male Female No res Male Female Male Female667 0 1089 735 0 517 134 45 214251800003631617890Male Female60.8 56.260.9 57.332.1 52.526.9 0.06 0 23 3 0 0 18.9 23.7% Schools recvd. Incentives : Number of beneficiaries(Previous year)(Previous academic year)School T L Mdev. grant grant Incentive Primary Upper primary86.9 86.1 Type Boys Girls Boys Girls83.1 81.1 Text books 48765 141358 10332 3842963.6 52.3 Uniform 331 324 7 1250.0 50.0 Attendance 4245 3100 373 27636.0 29.3 Stationery 68 106 120 529# = not applicable na = not available * Some totals may not match due to no response <strong>in</strong> classificatory data items2300150094.7 43.991.7 44.895.6 21.696.2 23.8%Teachers recvd.<strong>in</strong>-service tra<strong>in</strong><strong>in</strong>g93Bihar


