

64 Elementary Education in India - Where do we stand ? - DISE
64 Elementary Education in India - Where do we stand ? - DISE
64 Elementary Education in India - Where do we stand ? - DISE

Create successful ePaper yourself
Turn your PDF publications into a flip-book with our unique Google optimized e-Paper software.
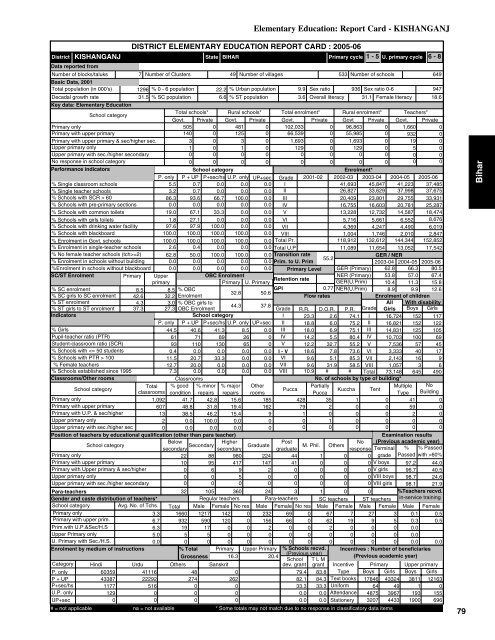
KISHANGANJDistrictData reported fromNumber of blocks/taluksBasic Data, 2001Total population (<strong>in</strong> 000's)Decadal growth rateDISTRICT ELEMENTARY EDUCATION REPORT CARD : 2005-06State7 Number of Clusters 49 Number of villages533 Number of schools<strong>64</strong>91296 % 0 - 6 population 22.2 % Urban population 9.9 Sex ratio 936 Sex ratio 0-694731.5 % SC population 6.6 % ST population3.6 Overall literacy 31.1 Female literacy 18.6Primary cycle 1 - 5 U. primary cycle 6 - 8Key data: <strong>Elementary</strong> <strong>Education</strong>School categoryTotal schools* Rural schools* Total enrolment* Rural enrolment* Teachers*Govt. Private Govt. Private Govt. Private Govt Private Govt. PrivatePrimary only505 0 481 0 102,033 0 96,863 0 1,660 0Primary with upper primary140 0 125 0 66,539 0 55,985 0 932 0Primary with upper primary & sec/higher sec.3 0 3 0 1,693 0 1,693 0 19 0Upper primary only1 0 1 0 129 0 129 0 5 0Upper primary with sec./higher secondary0 0 0 0 0 0 0 0 0 0No response <strong>in</strong> school category0 0 0 0 0 0 0 0 0 0Performance <strong>in</strong>dicatorsSchool categoryEnrolment*P. only P + UP P+sec/hs U.P. only UP+sec Grade 2001-02 2002-03 2003-04 2004-05 2005-06% S<strong>in</strong>gle classroom schools5.5 0.7 0.0 0.0 0.0 I41,693 45,847 41,223 37,485% S<strong>in</strong>gle teacher schools3.2 0.7 0.0 0.0 0.0 II26,827 33,629 37,998 37,675% Schools with SCR > 6086.3 93.6 66.7 100.0 0.0 III20,409 23,801 29,755 33,931% Schools with pre-primary sections 0.0 0.0 0.0 0.0 0.0 IV16,755 16,603 20,781 25,287% Schools with common toilets 19.0 67.1 33.3 0.0 0.0 V13,228 12,732 14,587 18,474% Schools with girls toilets 1.8 27.1 0.0 0.0 0.0 VI5,716 5,661 6,552 8,676% Schools with dr<strong>in</strong>k<strong>in</strong>g water facility 97.6 97.9 100.0 0.0 0.0 VII4,369 4,247 4,490 6,019% Schools with blackboard100.0 100.0 100.0 100.0 0.0 VIII 1,004 1,746 2,010 2,847% Enrolment <strong>in</strong> Govt. schools 100.0 100.0 100.0 100.0 0.0 Total Pr. 118,912 132,612 144,344 152,852% Enrolment <strong>in</strong> s<strong>in</strong>gle-teacher schools2.6 0.4 0.0 0.0 0.0 Total U.P11,089 11,654 13,052 17,542% No female teacher schools (tch>=2) 62.8 50.0 100.0 100.0 0.0 Transition rateGER / NER55.2% Enrolment <strong>in</strong> schools without build<strong>in</strong>g 0.0 0.0 0.0 0.0 0.0 Prim. to U. Prim2003-04 2004-05 2005-06%Enrolment <strong>in</strong> schools without blackboard 0.0 0.0 0.0 0.0 0.0 Primary Level GER (Primary) 62.8 66.3 80.5SC/ST EnrolmentPrimary UpperOBC EnrolmentNER (Primary) 53.8 57.0 67.4Retention rateprimaryPrimary U. PrimaryGER(U.Prim) 10.4 11.3 15.8% SC enrolment8.5 8.5 % OBCGPI0.77 NER(U.Prim) 8.9 9.9 12.632.8 50.6% SC girls to SC enrolment 42.6 32.2 EnrolmentFlow ratesEnrolment of children% ST enrolment4.3 3.0 % OBC girls toAll With disability44.3 37.8% ST girls to ST enrolment 37.3 27.3 OBC EnrolmentGrade R.R. D.O.R. P.R. Grade Girls Boys GirlsIndicatorsSchool categoryI 23.3 2.6 74.1 I 16,724 152 117P. only P + UP P+sec/hs U.P. only UP+sec II 18.8 6.0 75.2 II 16,821 152 122% Girls44.5 40.6 41.3 8.5 0.0 III 18.0 6.9 75.1 III 14,831 125 105Pupil-teacher ratio (PTR)61 71 89 26 0 IV 14.2 5.5 80.4 IV 10,703 100 69Student-classroom ratio (SCR)93 110 130 65 0 V 12.2 32.7 55.2 V 7,536 57 45% Schools with 10011.5 20.7 33.3 0.0 0.0 VI 9.6 5.1 85.3 VII 2,143 16 9% Female teachers12.7 20.0 0.0 0.0 0.0 VII 9.6 31.9 58.5 VIII 1,057 3 6% Schools established s<strong>in</strong>ce 19957.3 0.0 0.0 0.0 0.0 VIII 10.9 # # Total 73,148 <strong>64</strong>5 490Classrooms/Other roomsClassroomsNo. of schools by type of build<strong>in</strong>g*School categoryTotal % good % m<strong>in</strong>or % major OtherPartiallyMultiple NoPuccaKuccha Tentclassrooms condition repairs repairs roomsPuccaType Build<strong>in</strong>gPrimary only1,092 41.7 42.8 15.6 185 428 35 1 0 41 0Primary with upper primary607 48.8 31.8 19.4 16279 2 0 0 59 0Primary with U.P. & sec/higher13 38.5 46.2 15.491 0 0 0 2 0Upper primary only2 0.0 100.0 0.000 1 0 0 0 0Upper primary with sec./higher sec0 0.0 0.0 0.000 0 0 0 0 0Position of teachers by educational qualification (other than para teacher)Exam<strong>in</strong>ation resultsSchool category BelowHigherPost(Previous academic year)M. Phil.secondarysecondarygraduateNoresponse Term<strong>in</strong>al % % Passed22 88 980 224 44 1 0 0 grade Passed with >60%V boysPrimary onlyPrimary with upper primaryPrimary with Upper primary & sec/higher10 95 417 147 41 0 0 097.2 44.00 6 9 2 0 0 0 0 V girls 96.7 40.5Upper primary only0 0 5 0 0 0 0 0 VIII boys 98.7 24.6Upper primary with sec./higher secondary0 0 0 0 0 0 0 0 VIII girls 98.1 21.9Para-teachers32 105 360 24 3 1 0 0%Teachers recvd.Gender and caste distribution of teachers*Regular teachers Para-teachers SC teachers ST teachers <strong>in</strong>-service tra<strong>in</strong><strong>in</strong>gSchool categoryAvg. No. of Tchs. Total Male Female No res Male Female No res Male Female Male Female Male FemalePrimary only3.3 1660 1217 142 0 232 69 0 67 7 27 3 0.1 0.5Primary with upper prim.6.7 932 590 120 0 156 66 0 62 19 9 5 0.3 0.5Prim.with U.P.&Sec/H.S6.3 19 17 0 0 2 0 0 2 0 0 0 0.0Upper Primary only5.0 5 5 0 0 0 0 0 0 0 0 0 0.0U. Primary with Sec./H.S.0.0 0 0 0 0 0 0 0 0 0 0 0 0.0 0.0Enrolment by medium of <strong>in</strong>structions% Total Primary Upper Primary % Schools recvd. Incentives : Number of beneficiaries(Previous year)Grossness 16.3 20.4(Previous academic year)School T L MCategory H<strong>in</strong>di Urdu Others Sanskritdev. grant grantPrimary Upper primary60359Boys Girls Boys GirlsP. onlyP + UPP+sec/hsU.P. onlyUP+sec433871177129041116222925160048274000BIHAR0262000<strong>Elementary</strong> <strong>Education</strong>: Report Card - KISHANGANJ79.482.133.30.00.083.884.333.30.00.0IncentiveTypeText booksUniformAttendanceStationery# = not applicable na = not available * Some totals may not match due to no response <strong>in</strong> classificatory data items17846<strong>64</strong>4875320743324493967443338111193190012163015569679Bihar


