1 CHAPTER 1: INTRODUCTION 1.0 Chapter ... - DSpace@UM
1 CHAPTER 1: INTRODUCTION 1.0 Chapter ... - DSpace@UM
1 CHAPTER 1: INTRODUCTION 1.0 Chapter ... - DSpace@UM

You also want an ePaper? Increase the reach of your titles
YUMPU automatically turns print PDFs into web optimized ePapers that Google loves.
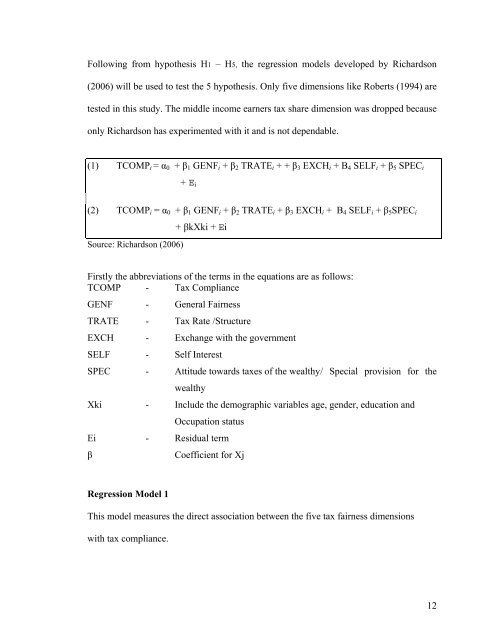
Following from hypothesis H1 – H5, the regression models developed by Richardson(2006) will be used to test the 5 hypothesis. Only five dimensions like Roberts (1994) aretested in this study. The middle income earners tax share dimension was dropped becauseonly Richardson has experimented with it and is not dependable.(1) TCOMP i = α 0 + β 1 GENF i + β 2 TRATE i + + β 3 EXCH i + Β 4 SELF i + β 5 SPEC i+ E i(2) TCOMP i = α 0 + β 1 GENF i + β 2 TRATE i + β 3 EXCH i + Β 4 SELF i + β 5 SPEC iSource: Richardson (2006)+ βkXki + EiFirstly the abbreviations of the terms in the equations are as follows:TCOMP - Tax ComplianceGENF - General FairnessTRATE - Tax Rate /StructureEXCH - Exchange with the governmentSELF - Self InterestSPEC - Attitude towards taxes of the wealthy / Special provision for thewealthyXki - Include the demographic variables age, gender, education andOccupation statusEi - Residual termβCoefficient for XjRegression Model 1This model measures the direct association between the five tax fairness dimensionswith tax compliance.12