1 CHAPTER 1: INTRODUCTION 1.0 Chapter ... - DSpace@UM
1 CHAPTER 1: INTRODUCTION 1.0 Chapter ... - DSpace@UM
1 CHAPTER 1: INTRODUCTION 1.0 Chapter ... - DSpace@UM
You also want an ePaper? Increase the reach of your titles
YUMPU automatically turns print PDFs into web optimized ePapers that Google loves.
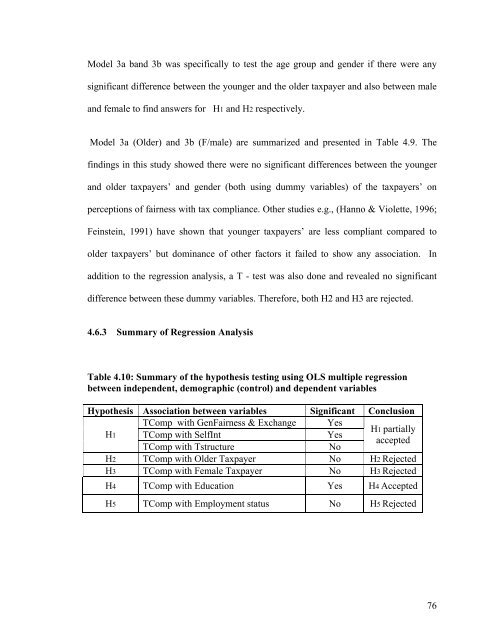
Model 3a band 3b was specifically to test the age group and gender if there were anysignificant difference between the younger and the older taxpayer and also between maleand female to find answers for H1 and H2 respectively.Model 3a (Older) and 3b (F/male) are summarized and presented in Table 4.9. Thefindings in this study showed there were no significant differences between the youngerand older taxpayers’ and gender (both using dummy variables) of the taxpayers’ onperceptions of fairness with tax compliance. Other studies e.g., (Hanno & Violette, 1996;Feinstein, 1991) have shown that younger taxpayers’ are less compliant compared toolder taxpayers’ but dominance of other factors it failed to show any association. Inaddition to the regression analysis, a T - test was also done and revealed no significantdifference between these dummy variables. Therefore, both H2 and H3 are rejected.4.6.3 Summary of Regression AnalysisTable 4.10: Summary of the hypothesis testing using OLS multiple regressionbetween independent, demographic (control) and dependent variablesHypothesis Association between variables Significant ConclusionH1TComp with GenFairness & Exchange YesH1 partiallyTComp with SelfIntYesacceptedTComp with TstructureNoH2 TComp with Older Taxpayer No H2 RejectedH3 TComp with Female Taxpayer No H3 RejectedH4 TComp with Education Yes H4 AcceptedH5 TComp with Employment status No H5 Rejected76


