1 CHAPTER 1: INTRODUCTION 1.0 Chapter ... - DSpace@UM
1 CHAPTER 1: INTRODUCTION 1.0 Chapter ... - DSpace@UM
1 CHAPTER 1: INTRODUCTION 1.0 Chapter ... - DSpace@UM

You also want an ePaper? Increase the reach of your titles
YUMPU automatically turns print PDFs into web optimized ePapers that Google loves.
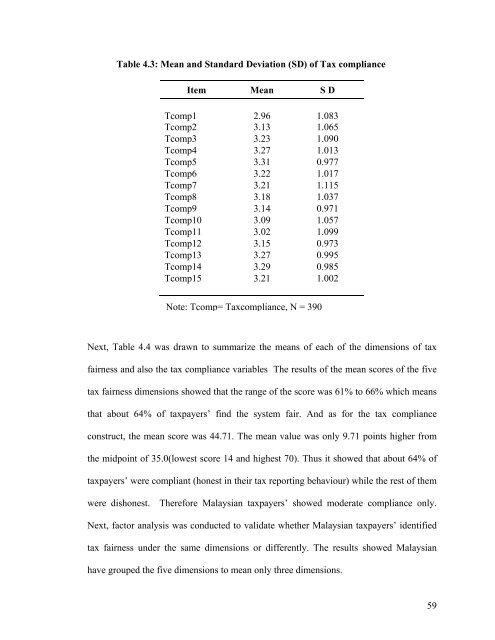
Table 4.3: Mean and Standard Deviation (SD) of Tax complianceItem Mean S DTcomp1 2.96 <strong>1.0</strong>83Tcomp2 3.13 <strong>1.0</strong>65Tcomp3 3.23 <strong>1.0</strong>90Tcomp4 3.27 <strong>1.0</strong>13Tcomp5 3.31 0.977Tcomp6 3.22 <strong>1.0</strong>17Tcomp7 3.21 1.115Tcomp8 3.18 <strong>1.0</strong>37Tcomp9 3.14 0.971Tcomp10 3.09 <strong>1.0</strong>57Tcomp11 3.02 <strong>1.0</strong>99Tcomp12 3.15 0.973Tcomp13 3.27 0.995Tcomp14 3.29 0.985Tcomp15 3.21 <strong>1.0</strong>02Note: Tcomp= Taxcompliance, N = 390Next, Table 4.4 was drawn to summarize the means of each of the dimensions of taxfairness and also the tax compliance variables The results of the mean scores of the fivetax fairness dimensions showed that the range of the score was 61% to 66% which meansthat about 64% of taxpayers’ find the system fair. And as for the tax complianceconstruct, the mean score was 44.71. The mean value was only 9.71 points higher fromthe midpoint of 35.0(lowest score 14 and highest 70). Thus it showed that about 64% oftaxpayers’ were compliant (honest in their tax reporting behaviour) while the rest of themwere dishonest. Therefore Malaysian taxpayers’ showed moderate compliance only.Next, factor analysis was conducted to validate whether Malaysian taxpayers’ identifiedtax fairness under the same dimensions or differently. The results showed Malaysianhave grouped the five dimensions to mean only three dimensions.59