1 CHAPTER 1: INTRODUCTION 1.0 Chapter ... - DSpace@UM
1 CHAPTER 1: INTRODUCTION 1.0 Chapter ... - DSpace@UM
1 CHAPTER 1: INTRODUCTION 1.0 Chapter ... - DSpace@UM

Create successful ePaper yourself
Turn your PDF publications into a flip-book with our unique Google optimized e-Paper software.
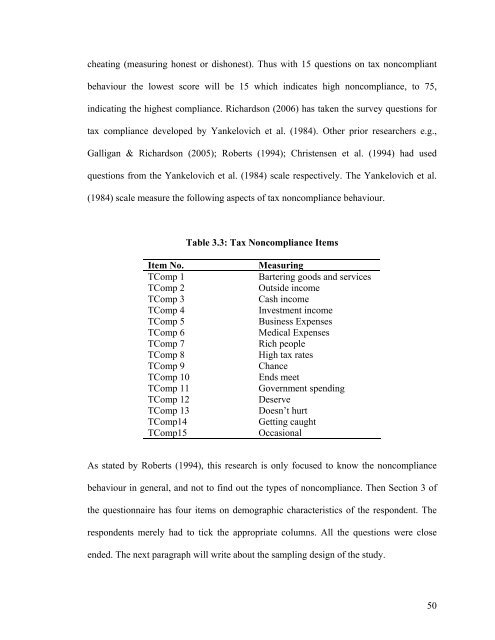
cheating (measuring honest or dishonest). Thus with 15 questions on tax noncompliantbehaviour the lowest score will be 15 which indicates high noncompliance, to 75,indicating the highest compliance. Richardson (2006) has taken the survey questions fortax compliance developed by Yankelovich et al. (1984). Other prior researchers e.g.,Galligan & Richardson (2005); Roberts (1994); Christensen et al. (1994) had usedquestions from the Yankelovich et al. (1984) scale respectively. The Yankelovich et al.(1984) scale measure the following aspects of tax noncompliance behaviour.Table 3.3: Tax Noncompliance ItemsItem No.TComp 1TComp 2TComp 3TComp 4TComp 5TComp 6TComp 7TComp 8TComp 9TComp 10TComp 11TComp 12TComp 13TComp14TComp15MeasuringBartering goods and servicesOutside incomeCash incomeInvestment incomeBusiness ExpensesMedical ExpensesRich peopleHigh tax ratesChanceEnds meetGovernment spendingDeserveDoesn’t hurtGetting caughtOccasionalAs stated by Roberts (1994), this research is only focused to know the noncompliancebehaviour in general, and not to find out the types of noncompliance. Then Section 3 ofthe questionnaire has four items on demographic characteristics of the respondent. Therespondents merely had to tick the appropriate columns. All the questions were closeended. The next paragraph will write about the sampling design of the study.50