1 CHAPTER 1: INTRODUCTION 1.0 Chapter ... - DSpace@UM
1 CHAPTER 1: INTRODUCTION 1.0 Chapter ... - DSpace@UM
1 CHAPTER 1: INTRODUCTION 1.0 Chapter ... - DSpace@UM

Create successful ePaper yourself
Turn your PDF publications into a flip-book with our unique Google optimized e-Paper software.
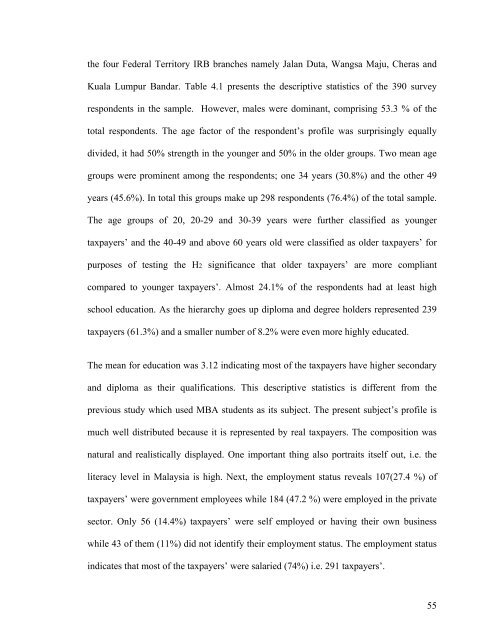
the four Federal Territory IRB branches namely Jalan Duta, Wangsa Maju, Cheras andKuala Lumpur Bandar. Table 4.1 presents the descriptive statistics of the 390 surveyrespondents in the sample. However, males were dominant, comprising 53.3 % of thetotal respondents. The age factor of the respondent’s profile was surprisingly equallydivided, it had 50% strength in the younger and 50% in the older groups. Two mean agegroups were prominent among the respondents; one 34 years (30.8%) and the other 49years (45.6%). In total this groups make up 298 respondents (76.4%) of the total sample.The age groups of 20, 20-29 and 30-39 years were further classified as youngertaxpayers’ and the 40-49 and above 60 years old were classified as older taxpayers’ forpurposes of testing the H2 significance that older taxpayers’ are more compliantcompared to younger taxpayers’. Almost 24.1% of the respondents had at least highschool education. As the hierarchy goes up diploma and degree holders represented 239taxpayers (61.3%) and a smaller number of 8.2% were even more highly educated.The mean for education was 3.12 indicating most of the taxpayers have higher secondaryand diploma as their qualifications. This descriptive statistics is different from theprevious study which used MBA students as its subject. The present subject’s profile ismuch well distributed because it is represented by real taxpayers. The composition wasnatural and realistically displayed. One important thing also portraits itself out, i.e. theliteracy level in Malaysia is high. Next, the employment status reveals 107(27.4 %) oftaxpayers’ were government employees while 184 (47.2 %) were employed in the privatesector. Only 56 (14.4%) taxpayers’ were self employed or having their own businesswhile 43 of them (11%) did not identify their employment status. The employment statusindicates that most of the taxpayers’ were salaried (74%) i.e. 291 taxpayers’.55