1 CHAPTER 1: INTRODUCTION 1.0 Chapter ... - DSpace@UM
1 CHAPTER 1: INTRODUCTION 1.0 Chapter ... - DSpace@UM
1 CHAPTER 1: INTRODUCTION 1.0 Chapter ... - DSpace@UM

You also want an ePaper? Increase the reach of your titles
YUMPU automatically turns print PDFs into web optimized ePapers that Google loves.
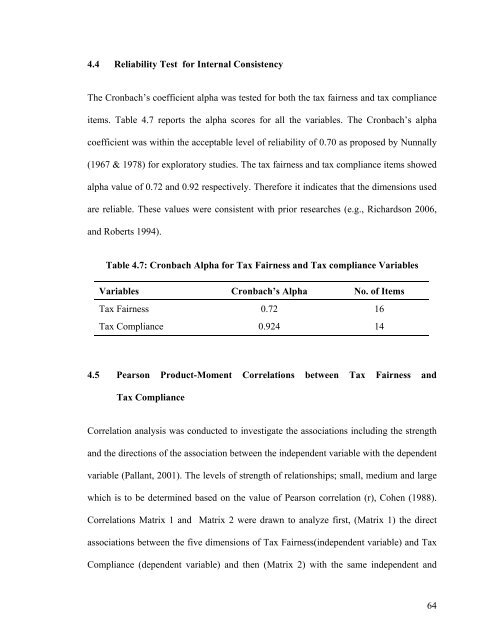
4.4 Reliability Test for Internal ConsistencyThe Cronbach’s coefficient alpha was tested for both the tax fairness and tax complianceitems. Table 4.7 reports the alpha scores for all the variables. The Cronbach’s alphacoefficient was within the acceptable level of reliability of 0.70 as proposed by Nunnally(1967 & 1978) for exploratory studies. The tax fairness and tax compliance items showedalpha value of 0.72 and 0.92 respectively. Therefore it indicates that the dimensions usedare reliable. These values were consistent with prior researches (e.g., Richardson 2006,and Roberts 1994).Table 4.7: Cronbach Alpha for Tax Fairness and Tax compliance VariablesVariables Cronbach’s Alpha No. of ItemsTax Fairness 0.72 16Tax Compliance 0.924 144.5 Pearson Product-Moment Correlations between Tax Fairness andTax ComplianceCorrelation analysis was conducted to investigate the associations including the strengthand the directions of the association between the independent variable with the dependentvariable (Pallant, 2001). The levels of strength of relationships; small, medium and largewhich is to be determined based on the value of Pearson correlation (r), Cohen (1988).Correlations Matrix 1 and Matrix 2 were drawn to analyze first, (Matrix 1) the directassociations between the five dimensions of Tax Fairness(independent variable) and TaxCompliance (dependent variable) and then (Matrix 2) with the same independent and64