1 CHAPTER 1: INTRODUCTION 1.0 Chapter ... - DSpace@UM
1 CHAPTER 1: INTRODUCTION 1.0 Chapter ... - DSpace@UM
1 CHAPTER 1: INTRODUCTION 1.0 Chapter ... - DSpace@UM

You also want an ePaper? Increase the reach of your titles
YUMPU automatically turns print PDFs into web optimized ePapers that Google loves.
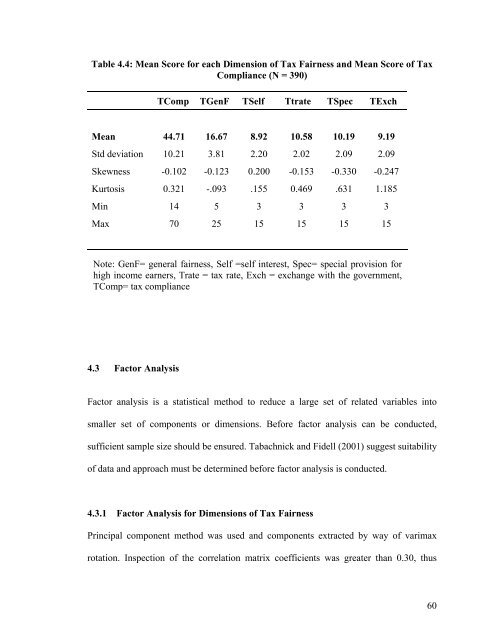
Table 4.4: Mean Score for each Dimension of Tax Fairness and Mean Score of TaxCompliance (N = 390)TComp TGenF TSelf Ttrate TSpec TExchMean 44.71 16.67 8.92 10.58 10.19 9.19Std deviation 10.21 3.81 2.20 2.02 2.09 2.09Skewness -0.102 -0.123 0.200 -0.153 -0.330 -0.247Kurtosis 0.321 -.093 .155 0.469 .631 1.185Min 14 5 3 3 3 3Max 70 25 15 15 15 15Note: GenF= general fairness, Self =self interest, Spec= special provision forhigh income earners, Trate = tax rate, Exch = exchange with the government,TComp= tax compliance4.3 Factor AnalysisFactor analysis is a statistical method to reduce a large set of related variables intosmaller set of components or dimensions. Before factor analysis can be conducted,sufficient sample size should be ensured. Tabachnick and Fidell (2001) suggest suitabilityof data and approach must be determined before factor analysis is conducted.4.3.1 Factor Analysis for Dimensions of Tax FairnessPrincipal component method was used and components extracted by way of varimaxrotation. Inspection of the correlation matrix coefficients was greater than 0.30, thus60