Paving the Way for Climate-Resilient Infrastructure - UN CC:Learn
Paving the Way for Climate-Resilient Infrastructure - UN CC:Learn
Paving the Way for Climate-Resilient Infrastructure - UN CC:Learn

Create successful ePaper yourself
Turn your PDF publications into a flip-book with our unique Google optimized e-Paper software.
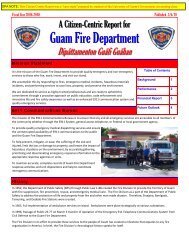
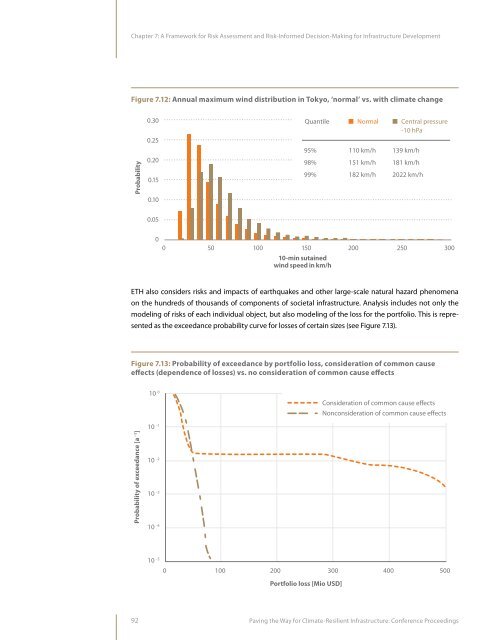
Chapter 7: A Framework <strong>for</strong> Risk Assessment and Risk-In<strong>for</strong>med Decision-Making <strong>for</strong> <strong>Infrastructure</strong> DevelopmentFigure 7.12: Annual maximum wind distribution in Tokyo, ‘normal’ vs. with climate change0.300.25QuantileNormalCentral pressure-10 hPaProbability0.200.1595%98%99%110 km/h151 km/h182 km/h139 km/h181 km/h2022 km/h0.100.0500 50 100 150 200 250 30010-min sutainedwind speed in km/hETH also considers risks and impacts of earthquakes and o<strong>the</strong>r large-scale natural hazard phenomenaon <strong>the</strong> hundreds of thousands of components of societal infrastructure. Analysis includes not only <strong>the</strong>modeling of risks of each individual object, but also modeling of <strong>the</strong> loss <strong>for</strong> <strong>the</strong> portfolio. This is representedas <strong>the</strong> exceedance probability curve <strong>for</strong> losses of certain sizes (see Figure 7.13).Figure 7.13: Probability of exceedance by portfolio loss, consideration of common causeeffects (dependence of losses) vs. no consideration of common cause effects10 0Consideration of common cause effectsNonconsideration of common cause effectsProbability of exceedance [a -1 ]10 -110 -210 -310 -410 -5 0100 200 300 400 500Portfolio loss [Mio USD]92<strong>Paving</strong> <strong>the</strong> <strong>Way</strong> <strong>for</strong> <strong>Climate</strong>-<strong>Resilient</strong> <strong>Infrastructure</strong>: Conference Proceedings