Paving the Way for Climate-Resilient Infrastructure - UN CC:Learn
Paving the Way for Climate-Resilient Infrastructure - UN CC:Learn
Paving the Way for Climate-Resilient Infrastructure - UN CC:Learn
Create successful ePaper yourself
Turn your PDF publications into a flip-book with our unique Google optimized e-Paper software.
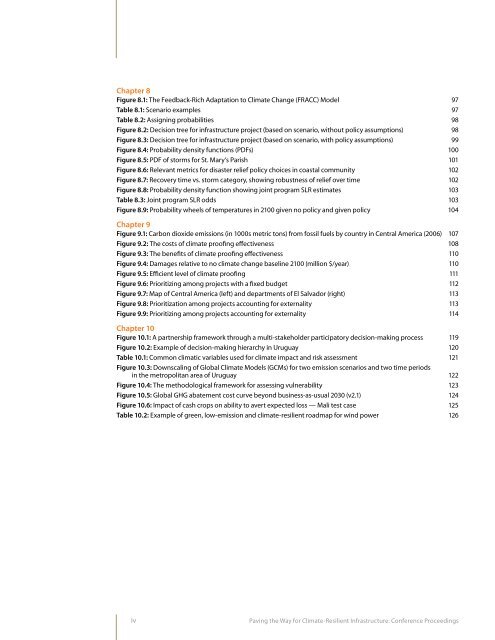
Chapter 8Figure 8.1: The Feedback-Rich Adaptation to <strong>Climate</strong> Change (FRA<strong>CC</strong>) Model 97Table 8.1: Scenario examples 97Table 8.2: Assigning probabilities 98Figure 8.2: Decision tree <strong>for</strong> infrastructure project (based on scenario, without policy assumptions) 98Figure 8.3: Decision tree <strong>for</strong> infrastructure project (based on scenario, with policy assumptions) 99Figure 8.4: Probability density functions (PDFs) 100Figure 8.5: PDF of storms <strong>for</strong> St. Mary’s Parish 101Figure 8.6: Relevant metrics <strong>for</strong> disaster relief policy choices in coastal community 102Figure 8.7: Recovery time vs. storm category, showing robustness of relief over time 102Figure 8.8: Probability density function showing joint program SLR estimates 103Table 8.3: Joint program SLR odds 103Figure 8.9: Probability wheels of temperatures in 2100 given no policy and given policy 104Chapter 9Figure 9.1: Carbon dioxide emissions (in 1000s metric tons) from fossil fuels by country in Central America (2006) 107Figure 9.2: The costs of climate proofing effectiveness 108Figure 9.3: The benefits of climate proofing effectiveness 110Figure 9.4: Damages relative to no climate change baseline 2100 (million $/year) 110Figure 9.5: Efficient level of climate proofing 111Figure 9.6: Prioritizing among projects with a fixed budget 112Figure 9.7: Map of Central America (left) and departments of El Salvador (right) 113Figure 9.8: Prioritization among projects accounting <strong>for</strong> externality 113Figure 9.9: Prioritizing among projects accounting <strong>for</strong> externality 114Chapter 10Figure 10.1: A partnership framework through a multi-stakeholder participatory decision-making process 119Figure 10.2: Example of decision-making hierarchy in Uruguay 120Table 10.1: Common climatic variables used <strong>for</strong> climate impact and risk assessment 121Figure 10.3: Downscaling of Global <strong>Climate</strong> Models (GCMs) <strong>for</strong> two emission scenarios and two time periodsin <strong>the</strong> metropolitan area of Uruguay 122Figure 10.4: The methodological framework <strong>for</strong> assessing vulnerability 123Figure 10.5: Global GHG abatement cost curve beyond business-as-usual 2030 (v2.1) 124Figure 10.6: Impact of cash crops on ability to avert expected loss — Mali test case 125Table 10.2: Example of green, low-emission and climate-resilient roadmap <strong>for</strong> wind power 126iv<strong>Paving</strong> <strong>the</strong> <strong>Way</strong> <strong>for</strong> <strong>Climate</strong>-<strong>Resilient</strong> <strong>Infrastructure</strong>: Conference Proceedings


