Paving the Way for Climate-Resilient Infrastructure - UN CC:Learn
Paving the Way for Climate-Resilient Infrastructure - UN CC:Learn
Paving the Way for Climate-Resilient Infrastructure - UN CC:Learn

You also want an ePaper? Increase the reach of your titles
YUMPU automatically turns print PDFs into web optimized ePapers that Google loves.
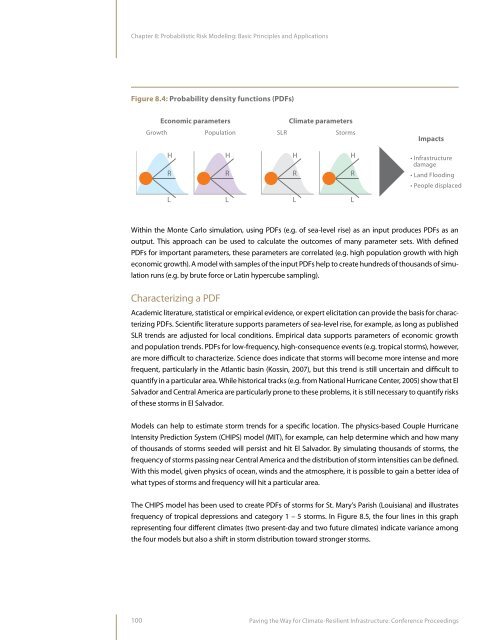
Chapter 8: Probabilistic Risk Modeling: Basic Principles and ApplicationsFigure 8.4: Probability density functions (PDFs)Economic parametersGrowthPopulation<strong>Climate</strong> parametersSLRStormsImpactsHRHRHRHR• <strong>Infrastructure</strong>damage• Land Flooding• People displacedLLLLWithin <strong>the</strong> Monte Carlo simulation, using PDFs (e.g. of sea-level rise) as an input produces PDFs as anoutput. This approach can be used to calculate <strong>the</strong> outcomes of many parameter sets. With definedPDFs <strong>for</strong> important parameters, <strong>the</strong>se parameters are correlated (e.g. high population growth with higheconomic growth). A model with samples of <strong>the</strong> input PDFs help to create hundreds of thousands of simulationruns (e.g. by brute <strong>for</strong>ce or Latin hypercube sampling).Characterizing a PDFAcademic literature, statistical or empirical evidence, or expert elicitation can provide <strong>the</strong> basis <strong>for</strong> characterizingPDFs. Scientific literature supports parameters of sea-level rise, <strong>for</strong> example, as long as publishedSLR trends are adjusted <strong>for</strong> local conditions. Empirical data supports parameters of economic growthand population trends. PDFs <strong>for</strong> low-frequency, high-consequence events (e.g. tropical storms), however,are more difficult to characterize. Science does indicate that storms will become more intense and morefrequent, particularly in <strong>the</strong> Atlantic basin (Kossin, 2007), but this trend is still uncertain and difficult toquantify in a particular area. While historical tracks (e.g. from National Hurricane Center, 2005) show that ElSalvador and Central America are particularly prone to <strong>the</strong>se problems, it is still necessary to quantify risksof <strong>the</strong>se storms in El Salvador.Models can help to estimate storm trends <strong>for</strong> a specific location. The physics-based Couple HurricaneIntensity Prediction System (CHIPS) model (MIT), <strong>for</strong> example, can help determine which and how manyof thousands of storms seeded will persist and hit El Salvador. By simulating thousands of storms, <strong>the</strong>frequency of storms passing near Central America and <strong>the</strong> distribution of storm intensities can be defined.With this model, given physics of ocean, winds and <strong>the</strong> atmosphere, it is possible to gain a better idea ofwhat types of storms and frequency will hit a particular area.The CHIPS model has been used to create PDFs of storms <strong>for</strong> St. Mary’s Parish (Louisiana) and illustratesfrequency of tropical depressions and category 1 – 5 storms. In Figure 8.5, <strong>the</strong> four lines in this graphrepresenting four different climates (two present-day and two future climates) indicate variance among<strong>the</strong> four models but also a shift in storm distribution toward stronger storms.100<strong>Paving</strong> <strong>the</strong> <strong>Way</strong> <strong>for</strong> <strong>Climate</strong>-<strong>Resilient</strong> <strong>Infrastructure</strong>: Conference Proceedings