Paving the Way for Climate-Resilient Infrastructure - UN CC:Learn
Paving the Way for Climate-Resilient Infrastructure - UN CC:Learn
Paving the Way for Climate-Resilient Infrastructure - UN CC:Learn

Create successful ePaper yourself
Turn your PDF publications into a flip-book with our unique Google optimized e-Paper software.
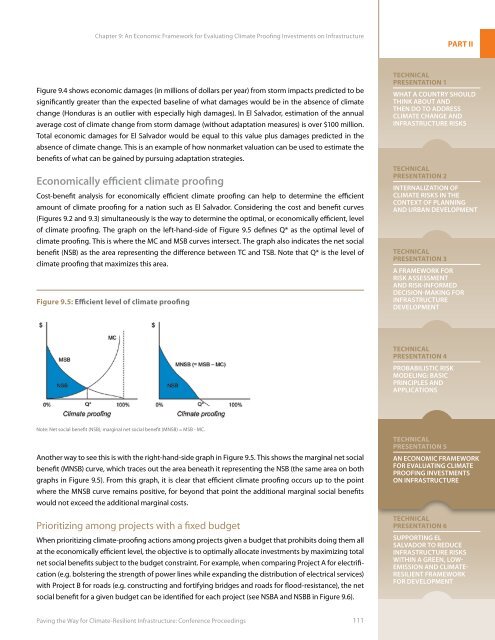
Chapter 9: An Economic Framework <strong>for</strong> Evaluating <strong>Climate</strong> Proofing Investments on <strong>Infrastructure</strong>PART IIFigure 9.4 shows economic damages (in millions of dollars per year) from storm impacts predicted to besignificantly greater than <strong>the</strong> expected baseline of what damages would be in <strong>the</strong> absence of climatechange (Honduras is an outlier with especially high damages). In El Salvador, estimation of <strong>the</strong> annualaverage cost of climate change from storm damage (without adaptation measures) is over $100 million.Total economic damages <strong>for</strong> El Salvador would be equal to this value plus damages predicted in <strong>the</strong>absence of climate change. This is an example of how nonmarket valuation can be used to estimate <strong>the</strong>benefits of what can be gained by pursuing adaptation strategies.Economically efficient climate proofingCost-benefit analysis <strong>for</strong> economically efficient climate proofing can help to determine <strong>the</strong> efficientamount of climate proofing <strong>for</strong> a nation such as El Salvador. Considering <strong>the</strong> cost and benefit curves(Figures 9.2 and 9.3) simultaneously is <strong>the</strong> way to determine <strong>the</strong> optimal, or economically efficient, levelof climate proofing. The graph on <strong>the</strong> left-hand-side of Figure 9.5 defines Q* as <strong>the</strong> optimal level ofclimate proofing. This is where <strong>the</strong> MC and MSB curves intersect. The graph also indicates <strong>the</strong> net socialbenefit (NSB) as <strong>the</strong> area representing <strong>the</strong> difference between TC and TSB. Note that Q* is <strong>the</strong> level ofclimate proofing that maximizes this area.Figure 9.5: Efficient level of climate proofingTechnicalPresentation 1What a Country ShouldThink About andThen Do to Address<strong>Climate</strong> Change and<strong>Infrastructure</strong> RisksTechnicalPresentation 2Internalization of<strong>Climate</strong> Risks in <strong>the</strong>Context of Planningand Urban DevelopmentTechnicalPresentation 3A Framework <strong>for</strong>Risk Assessmentand Risk-In<strong>for</strong>medDecision-Making <strong>for</strong><strong>Infrastructure</strong>DevelopmentTechnicalPresentation 4Probabilistic RiskModeling: BasicPrinciples andApplicationsNote: Net social benefit (NSB); marginal net social benefit (MNSB) = MSB - MC.Ano<strong>the</strong>r way to see this is with <strong>the</strong> right-hand-side graph in Figure 9.5. This shows <strong>the</strong> marginal net socialbenefit (MNSB) curve, which traces out <strong>the</strong> area beneath it representing <strong>the</strong> NSB (<strong>the</strong> same area on bothgraphs in Figure 9.5). From this graph, it is clear that efficient climate proofing occurs up to <strong>the</strong> pointwhere <strong>the</strong> MNSB curve remains positive, <strong>for</strong> beyond that point <strong>the</strong> additional marginal social benefitswould not exceed <strong>the</strong> additional marginal costs.Prioritizing among projects with a fixed budgetWhen prioritizing climate-proofing actions among projects given a budget that prohibits doing <strong>the</strong>m allat <strong>the</strong> economically efficient level, <strong>the</strong> objective is to optimally allocate investments by maximizing totalnet social benefits subject to <strong>the</strong> budget constraint. For example, when comparing Project A <strong>for</strong> electrification(e.g. bolstering <strong>the</strong> strength of power lines while expanding <strong>the</strong> distribution of electrical services)with Project B <strong>for</strong> roads (e.g. constructing and <strong>for</strong>tifying bridges and roads <strong>for</strong> flood-resistance), <strong>the</strong> netsocial benefit <strong>for</strong> a given budget can be identified <strong>for</strong> each project (see NSBA and NSBB in Figure 9.6).TechnicalPresentation 5An Economic Framework<strong>for</strong> Evaluating <strong>Climate</strong>Proofing Investmentson <strong>Infrastructure</strong>TechnicalPresentation 6Supporting ElSalvador to Reduce<strong>Infrastructure</strong> Riskswithin a Green, Low-Emission and <strong>Climate</strong>-<strong>Resilient</strong> Framework<strong>for</strong> Development<strong>Paving</strong> <strong>the</strong> <strong>Way</strong> <strong>for</strong> <strong>Climate</strong>-<strong>Resilient</strong> <strong>Infrastructure</strong>: Conference Proceedings 111