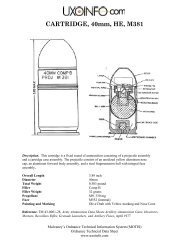
FINAL SITE INSPECTION REPORT
FINAL SITE INSPECTION REPORT
FINAL SITE INSPECTION REPORT

Create successful ePaper yourself
Turn your PDF publications into a flip-book with our unique Google optimized e-Paper software.
700701702703704705706707708709710711712713714715716717718719720721722723724725726727728729730731732733a computer software program that allows for an independent sampling location selection across adesignated area. The area provided to the VSP software was all areas within the FUDS boundarynot included in a known AOC. After VSP identified potential sampling locations, the locationswere adjusted by hand to place the background sample location on a property for which theUSACE had a signed ROE. Background sediment sampling locations were collected from alocation upstream of the Boardman AFR AOCs.The background soil sample analytical results were used to calculate background metal soilconcentrations using published EPA Guidance (1989, 1992, 1994, 1995, and 2006). Thebackground concentrations are either a 95 th upper tolerance limit (UTL) for normally andlognormally distributed analytes or the 95 th percentile for nonparametric distributed analytes.The background soil sample analytical results are provided in Appendix G. Table 3-2 lists thesoil, sediment and groundwater metals background concentrations used in this report. Table 3-2also includes the background concentration for perchlorate in groundwater that was obtainedduring the PA/SI (Weston, 2004). A summary of the soil background calculations is presented inAppendix L.One sediment background sample (NWO-030-5011) was collected in the vicinity of BoardmanAFR (Figure 3-2) during the SI and analyzed for metals. The analytical results are presented inAppendix G.Groundwater background concentrations were from samples collected from PGE well 120located upgradient of the Target No. 1 and Carty Reservoir AOCs. The well location is shownon Figure 3-2. Metal background concentrations were obtained from the PGE Boardman Plant2005 Water Quality Monitoring Report. A copy of the report is provided in Appendix L. PGEmonitors for all metal analytes of concern except mercury and perchlorate. The perchloratebackground concentration was obtained from the PA/SI report (Weston, 2004). Note that thePA/SI identified the sample location as GW-MW025, which is the same well as PGE well 120.The groundwater background concentrations are listed on Table 3-2.The method for comparing sediment and groundwater results to background was not defined inthe TPP process. For purposes of comparison in this SI, the background concentrations forsediments and groundwater are taken to be the background sample value. The approach fordetermining if a release has occurred is consistent with the EPAs HRS (40 CFR Part 300:Appendix A): The minimum standard to establish an observed release by chemical analysis isanalytical evidence of a hazardous substance in the media significantly above the backgroundlevel. Table 2-3, Observed Release Criteria for Chemical Analysis in the above referencedregulation has the following criteria:Boardman AFR Final SI Report.doc 3-7 Contract No. W912DY-04-D-0010 Delivery Order No. 003September 2007