ANNUAL REPORT 2009 - Saab
ANNUAL REPORT 2009 - Saab
ANNUAL REPORT 2009 - Saab
Create successful ePaper yourself
Turn your PDF publications into a flip-book with our unique Google optimized e-Paper software.
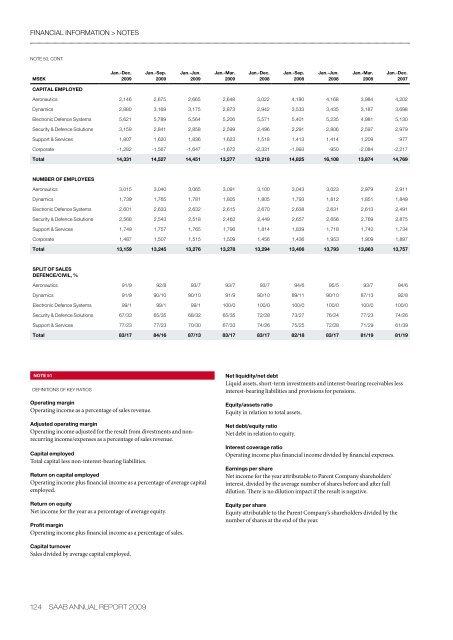
financial information > notesNote 50, cont.MSEKJan.-Dec.<strong>2009</strong>Jan.-Sep.<strong>2009</strong>Jan.-Jun.<strong>2009</strong>Jan.-Mar.<strong>2009</strong>Jan.-Dec.2008Jan.-Sep.2008Jan.-Jun.2008Jan.-Mar.2008Jan.-Dec.2007CAPITAL EMPLOYEDAeronautics 2,146 2,675 2,665 2,648 3,022 4,180 4,168 3,984 4,202Dynamics 2,880 3,169 3,175 2,873 2,942 3,533 3,435 3,187 3,698Electronic Defence Systems 5,621 5,789 5,564 5,206 5,571 5,401 5,235 4,981 5,130Security & Defence Solutions 3,159 2,841 2,858 2,599 2,496 2,291 2,806 2,597 2,979Support & Services 1,807 1,620 1,836 1,623 1,518 1,413 1,414 1,209 977Corporate -1,282 -1,567 -1,647 -1,672 -2,331 -1,993 -950 -2,084 -2,217Total 14,331 14,527 14,451 13,277 13,218 14,825 16,108 13,874 14,769NUMBER OF EMPLOYEESAeronautics 3,015 3,040 3,065 3,091 3,100 3,043 3,023 2,979 2,911Dynamics 1,739 1,765 1,781 1,805 1,805 1,793 1,812 1,851 1,849Electronic Defence Systems 2,601 2,633 2,632 2,615 2,670 2,638 2,631 2,613 2,491Security & Defence Solutions 2,568 2,543 2,518 2,462 2,449 2,657 2,656 2,769 2,875Support & Services 1,749 1,757 1,765 1,796 1,814 1,839 1,718 1,742 1,734Corporate 1,487 1,507 1,515 1,509 1,456 1,436 1,953 1,909 1,897Total 13,159 13,245 13,276 13,278 13,294 13,406 13,793 13,863 13,757SPLIT OF SALESDEFENCE/CIVIL, %Aeronautics 91/9 92/8 93/7 93/7 93/7 94/6 95/5 93/7 94/6Dynamics 91/9 90/10 90/10 91/9 90/10 89/11 90/10 87/13 92/8Electronic Defence Systems 99/1 99/1 99/1 100/0 100/0 100/0 100/0 100/0 100/0Security & Defence Solutions 67/33 65/35 68/32 65/35 72/28 73/27 76/24 77/23 74/26Support & Services 77/23 77/23 70/30 67/33 74/26 75/25 72/28 71/29 61/39Total 83/17 84/16 87/13 83/17 83/17 82/18 83/17 81/19 81/19NOTe 51DEFINITIONS OF KEY RATIOSOperating marginOperating income as a percentage of sales revenue.Adjusted operating marginOperating income adjusted for the result from divestments and nonrecurringincome/expenses as a percentage of sales revenue.Capital employedTotal capital less non-interest-bearing liabilities.Return on capital employedOperating income plus financial income as a percentage of average capitalemployed.Return on equityNet income for the year as a percentage of average equity.Profit marginOperating income plus financial income as a percentage of sales.Net liquidity/net debtLiquid assets, short-term investments and interest-bearing receivables lessinterest-bearing liabilities and provisions for pensions.Equity/assets ratioEquity in relation to total assets.Net debt/equity ratioNet debt in relation to equity.Interest coverage ratioOperating income plus financial income divided by financial expenses.Earnings per shareNet income for the year attributable to Parent Company shareholders’interest , divided by the average number of shares before and after fulldilution. There is no dilution impact if the result is negative.Equity per shareEquity attributable to the Parent Company’s shareholders divided by thenumber of shares at the end of the year.Capital turnoverSales divided by average capital employed.124 saab annual report <strong>2009</strong>






![Proposal long-term incentive programs [pdf] - Saab](https://img.yumpu.com/50411723/1/190x245/proposal-long-term-incentive-programs-pdf-saab.jpg?quality=85)
