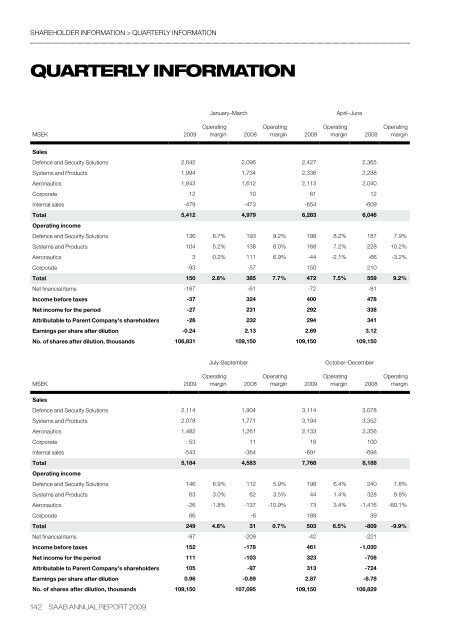
shareholder information > quarterly informationquarterly informationJanuary–MarchApril–JuneMSEK <strong>2009</strong>Operatingmargin 2008Operatingmargin <strong>2009</strong>Operatingmargin 2008OperatingmarginSalesDefence and Security Solutions 2,042 2,096 2,427 2,365Systems and Products 1,994 1,734 2,336 2,238Aeronautics 1,843 1,612 2,113 2,040Corporate 12 10 61 12Internal sales -479 -473 -654 -609Total 5,412 4,979 6,283 6,046Operating incomeDefence and Security Solutions 136 6.7% 193 9.2% 198 8.2% 187 7.9%Systems and Products 104 5.2% 138 8.0% 168 7.2% 228 10.2%Aeronautics 3 0.2% 111 6.9% -44 -2.1% -66 -3.2%Corporate -93 -57 150 210Total 150 2.8% 385 7.7% 472 7.5% 559 9.2%Net financial items -187 -61 -72 -81Income before taxes -37 324 400 478Net income for the period -27 231 292 338Attributable to Parent Company’s shareholders -26 232 294 341Earnings per share after dilution -0.24 2.13 2.69 3.12No. of shares after dilution, thousands 106,831 109,150 109,150 109,150July-SeptemberOctober–DecemberMSEK <strong>2009</strong>Operatingmargin 2008Operatingmargin <strong>2009</strong>Operatingmargin 2008OperatingmarginSalesDefence and Security Solutions 2,114 1,904 3,114 3,078Systems and Products 2,078 1,771 3,194 3,352Aeronautics 1,482 1,261 2,133 2,356Corporate 53 11 18 100Internal sales -543 -364 -691 -698Total 5,184 4,583 7,768 8,188Operating incomeDefence and Security Solutions 146 6.9% 112 5.9% 198 6.4% 240 7.8%Systems and Products 63 3.0% 62 3.5% 44 1.4% 328 9.8%Aeronautics -26 -1.8% -137 -10.9% 73 3.4% -1,416 -60.1%Corporate 66 -6 188 39Total 249 4.8% 31 0.7% 503 6.5% -809 -9.9%Net financial items -97 -209 -42 -221Income before taxes 152 -178 461 -1,030Net income for the period 111 -103 323 -708Attributable to Parent Company’s shareholders 105 -97 313 -724Earnings per share after dilution 0.96 -0.89 2.87 -6.78No. of shares after dilution, thousands 109,150 107,095 109,150 106,829142 saab annual report <strong>2009</strong>
shareholder information > multi-year overviewmulti-year overviewMSEK, unless otherwise indicated <strong>2009</strong> 2008 2007 2006 2005 2004 4) 2003 2002Order bookings 18,428 23,212 20,846 27,575 17,512 16,444 19,606 19,521Order backlog at year-end 39,389 45,324 47,316 50,445 42,198 43,162 45,636 43,082Net sales 24,647 23,796 23,021 21,063 19,314 17,848 17,250 16,538Foreign market sales, % 69 68 65 65 56 48 46 41Defence sales, % 83 83 81 79 82 80 80 76Operating income 1,374 166 2,607 1,745 1,652 1,853 1,293 1,220Operating margin, % 5.6 0.7 11.3 8.3 8.6 10.4 7.5 7.4Operating margin before depreciationexcluding leasing, %10.5 6.4 16.0 12.0 11.3 13.1 11.1 11.2Income after financial items 976 -406 2,449 1,693 1,551 1,712 1,073 993Net income for the year 699 -242 1,941 1,347 1,199 1,310 746 732Total assets 30,430 32,890 33,801 32,771 30,594 27,509 28,704 28,109of which <strong>Saab</strong> Aircraft Leasing 3,362 3,226 3,415 3,397 4,887 5,314 6,181 4,869of which advance payments, net 442 897 2,558 3,642 3,528 2,860 3,990 3,775of which shareholders’ equity 10,682 9,330 11,008 10,025 9,493 8,221 7,003 6,833equity per share, SEK 1) 99.91 86.49 101.53 89.80 84.10 74.89 65.75 64.17Net debt/Net liquidity excluding interest-bearing receivablesand after deduction of provisions for pensions-1,631 -3,061 -2,802 -261 5,144 3,211 3,149 2,655Net debt/liquidity -634 -1,693 -1,627 605 2,856 781 495 352Cash flow from operating activities 1,696 954 -1,304 969 2,541 865 1,348 1,060Operating cash flow 1,447 659 -1,603 -1,900 2,645 325 545 -92Average capital employed 13,775 13,994 13,430 12,789 12,925 12,386 11,629 11,926Return on capital employed, % 10.3 1.4 19.4 14.5 14.6 17.3 12.7 11.6Return on equity, % 7.0 -2.4 18.5 13.8 13.5 16.7 10.8 10.8Profit margin, % 5.78 0.82 11.4 8.83 9.73 11.74 8.5 8.4Capital turnover rate, multiple 1.79 1.70 1.71 1.65 1.49 1.47 1.48 1.39Equity/assets ratio, % 35.1 28.4 32.6 30.6 31.0 29.9 24.4 24.3Interest coverage ratio, % 3.16 0.35 21.4 13.47 6.08 6.08 3.70 3.55Earnings per share, SEK 2) 6.45 -2.31 17.68 11.91 10.89 11.78 7.00 6.87Earnings per share after dilution, SEK 3) 6.28 -2.31 17.60 11.91 10.89 11.78 6.91 6.78Dividend, SEK 5) 2.25 1.75 4.50 4.25 4.00 3.75 3.50 3.50Gross capital expenditures for tangible fixed assets 197 386 395 433 296 348 472 623Research and development costs 4,820 4,141 4,523 3,537 3,546 3,929 3,690 4,138Number of employees at year-end 13,159 13,294 13,757 13,577 12,830 11,936 13,414 14,0361) Number of shares as of 31 December <strong>2009</strong>: 105,511,124; 2008: 106,829,893; 2007: 108,150,344; 2006/2005/2004: 109,150,344; 2003: 106,517,563; and 2002: 106,510,374.2) Average number of shares <strong>2009</strong>: 106,335,553; 2008: 107,515,049; 2007: 108,668,700, 2006/2005: 109,150,344; 2004: 108,234,126; 2003: 106,513,969; and 2002: 106,487,407.3) Average number of shares <strong>2009</strong>: 109,150,344; 2008: 107,515,049; 2007/2006/2005: 109,150,344; 2004: 108,234,126; after dilution 2002–2003: 109,247,175. Conversion of debenture loan concluded 15 July 2004.4) Restated according to IFRS, previously not restated.5) <strong>2009</strong> Board of Directors proposal.saab annual report <strong>2009</strong> 143


![Proposal long-term incentive programs [pdf] - Saab](https://img.yumpu.com/50411723/1/190x245/proposal-long-term-incentive-programs-pdf-saab.jpg?quality=85)