ANNUAL REPORT 2009 - Saab
ANNUAL REPORT 2009 - Saab
ANNUAL REPORT 2009 - Saab

Create successful ePaper yourself
Turn your PDF publications into a flip-book with our unique Google optimized e-Paper software.
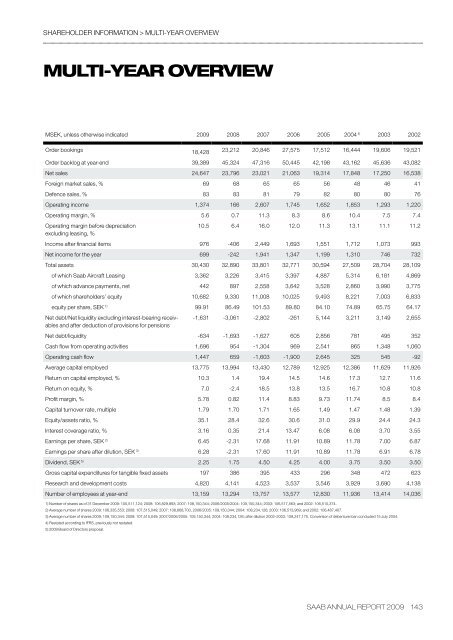
shareholder information > multi-year overviewmulti-year overviewMSEK, unless otherwise indicated <strong>2009</strong> 2008 2007 2006 2005 2004 4) 2003 2002Order bookings 18,428 23,212 20,846 27,575 17,512 16,444 19,606 19,521Order backlog at year-end 39,389 45,324 47,316 50,445 42,198 43,162 45,636 43,082Net sales 24,647 23,796 23,021 21,063 19,314 17,848 17,250 16,538Foreign market sales, % 69 68 65 65 56 48 46 41Defence sales, % 83 83 81 79 82 80 80 76Operating income 1,374 166 2,607 1,745 1,652 1,853 1,293 1,220Operating margin, % 5.6 0.7 11.3 8.3 8.6 10.4 7.5 7.4Operating margin before depreciationexcluding leasing, %10.5 6.4 16.0 12.0 11.3 13.1 11.1 11.2Income after financial items 976 -406 2,449 1,693 1,551 1,712 1,073 993Net income for the year 699 -242 1,941 1,347 1,199 1,310 746 732Total assets 30,430 32,890 33,801 32,771 30,594 27,509 28,704 28,109of which <strong>Saab</strong> Aircraft Leasing 3,362 3,226 3,415 3,397 4,887 5,314 6,181 4,869of which advance payments, net 442 897 2,558 3,642 3,528 2,860 3,990 3,775of which shareholders’ equity 10,682 9,330 11,008 10,025 9,493 8,221 7,003 6,833equity per share, SEK 1) 99.91 86.49 101.53 89.80 84.10 74.89 65.75 64.17Net debt/Net liquidity excluding interest-bearing receivablesand after deduction of provisions for pensions-1,631 -3,061 -2,802 -261 5,144 3,211 3,149 2,655Net debt/liquidity -634 -1,693 -1,627 605 2,856 781 495 352Cash flow from operating activities 1,696 954 -1,304 969 2,541 865 1,348 1,060Operating cash flow 1,447 659 -1,603 -1,900 2,645 325 545 -92Average capital employed 13,775 13,994 13,430 12,789 12,925 12,386 11,629 11,926Return on capital employed, % 10.3 1.4 19.4 14.5 14.6 17.3 12.7 11.6Return on equity, % 7.0 -2.4 18.5 13.8 13.5 16.7 10.8 10.8Profit margin, % 5.78 0.82 11.4 8.83 9.73 11.74 8.5 8.4Capital turnover rate, multiple 1.79 1.70 1.71 1.65 1.49 1.47 1.48 1.39Equity/assets ratio, % 35.1 28.4 32.6 30.6 31.0 29.9 24.4 24.3Interest coverage ratio, % 3.16 0.35 21.4 13.47 6.08 6.08 3.70 3.55Earnings per share, SEK 2) 6.45 -2.31 17.68 11.91 10.89 11.78 7.00 6.87Earnings per share after dilution, SEK 3) 6.28 -2.31 17.60 11.91 10.89 11.78 6.91 6.78Dividend, SEK 5) 2.25 1.75 4.50 4.25 4.00 3.75 3.50 3.50Gross capital expenditures for tangible fixed assets 197 386 395 433 296 348 472 623Research and development costs 4,820 4,141 4,523 3,537 3,546 3,929 3,690 4,138Number of employees at year-end 13,159 13,294 13,757 13,577 12,830 11,936 13,414 14,0361) Number of shares as of 31 December <strong>2009</strong>: 105,511,124; 2008: 106,829,893; 2007: 108,150,344; 2006/2005/2004: 109,150,344; 2003: 106,517,563; and 2002: 106,510,374.2) Average number of shares <strong>2009</strong>: 106,335,553; 2008: 107,515,049; 2007: 108,668,700, 2006/2005: 109,150,344; 2004: 108,234,126; 2003: 106,513,969; and 2002: 106,487,407.3) Average number of shares <strong>2009</strong>: 109,150,344; 2008: 107,515,049; 2007/2006/2005: 109,150,344; 2004: 108,234,126; after dilution 2002–2003: 109,247,175. Conversion of debenture loan concluded 15 July 2004.4) Restated according to IFRS, previously not restated.5) <strong>2009</strong> Board of Directors proposal.saab annual report <strong>2009</strong> 143

![Proposal long-term incentive programs [pdf] - Saab](https://img.yumpu.com/50411723/1/190x245/proposal-long-term-incentive-programs-pdf-saab.jpg?quality=85)