The <str<strong>on</strong>g>PODES</str<strong>on</strong>g> core data provides informati<strong>on</strong> <strong>on</strong> the existence of different types of health facilities inthe village, including hospitals, maternal hospitals, polyclinics, Puskesmas, Puskesmas Pembantu,Poskesdes, Polindes, and Posyandu, as well as physician’s and obstetrician’s practices. In case therespective facility is not available within the village/neighborhood, the core includes informati<strong>on</strong><strong>on</strong> a) the distance to and b) the ease of reaching the nearest facility.Both the core and the census include informati<strong>on</strong> <strong>on</strong> the number of physicians, dentists, midwives,nurses and other health pers<strong>on</strong>nel working in the facilities and villages. 5 Further, the infrastructurecensus c<strong>on</strong>tains informati<strong>on</strong> <strong>on</strong> the availability of a range of services and equipment at the facilitylevel. These variables are not available for those facilities that are not covered by the census (i.e.hospitals, polyclinics, physician’s and midwife’s practices). Aggregating this informati<strong>on</strong> at villageor sub-district level would hence <strong>on</strong>ly be accurate for those sub-districts where no hospitals andpolyclinics are present (which applies to around 60 percent of the 6,771 sub-districts). Finally, theinfrastructure census provides informati<strong>on</strong> <strong>on</strong> a range of building characteristics, of which theavailability of electricity and the supply of water, as well as indicators of roof and floor quality aremost suited to assess the physical c<strong>on</strong>diti<strong>on</strong> of facilities.Informati<strong>on</strong> <strong>on</strong> Educati<strong>on</strong> <str<strong>on</strong>g>Infrastructure</str<strong>on</strong>g>The data <strong>on</strong> educati<strong>on</strong> supply and infrastructure from the Core and the infrastructure census is alsocategorized al<strong>on</strong>g three dimensi<strong>on</strong>s: (i) physical availability; (ii) student numbers and teachercharacteristics; and (iii) available rooms and facility characteristics. Table II.2 provides anoverview.Informati<strong>on</strong> <strong>on</strong> existent public SD, SMP, SMA and SMK is available from both the Core and theinfrastructure census, while the Core additi<strong>on</strong>ally provides informati<strong>on</strong> <strong>on</strong> early childhoodeducati<strong>on</strong> facilities (PAUD and Kindergarten/TK), as well as the number of private facilities for allschool types, including academies, special schools (SLB), Islamic boarding schools, and Madrasahdiniyah. Further, the core includes informati<strong>on</strong> <strong>on</strong> the distance to the nearest school for each schooltype, if the respective facility is not present within the village or neighborhood.For all public schools the infrastructure census provides informati<strong>on</strong> <strong>on</strong> the number of students (bysex and grade), as well as the number of teachers, their type of c<strong>on</strong>tract (permanent vs. temporary),and their level of educati<strong>on</strong> (S1 degree or higher versus D3 degree or lower). With this informati<strong>on</strong>,the average number of students per class, student-teacher ratios, and the share of permanent and/orteachers holding at least an S1 degree are calculated for each school.As for the health facilities, the school census provides informati<strong>on</strong> <strong>on</strong> a range of buildingcharacteristics. We focus <strong>on</strong> the availability of electricity and water within the facility and5 In part, the numbers differ substantially between the two sources, which is due to the broader focus of theCore data (including hospitals, polyclinics, physician’s and midwife’s practices).4
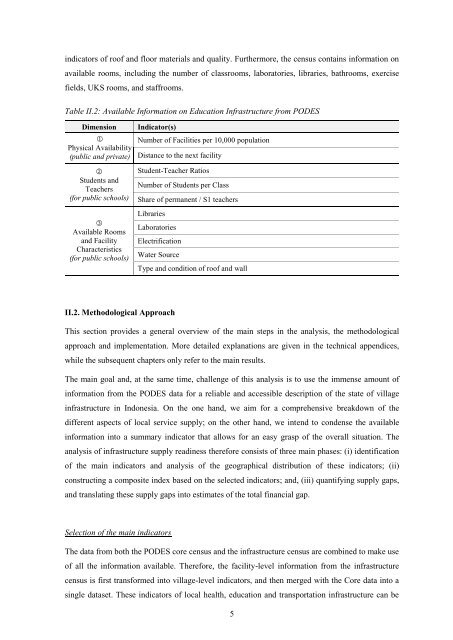
indicators of roof and floor materials and quality. Furthermore, the census c<strong>on</strong>tains informati<strong>on</strong> <strong>on</strong>available rooms, including the number of classrooms, laboratories, libraries, bathrooms, exercisefields, UKS rooms, and staffrooms.Table II.2: Available Informati<strong>on</strong> <strong>on</strong> Educati<strong>on</strong> <str<strong>on</strong>g>Infrastructure</str<strong>on</strong>g> from <str<strong>on</strong>g>PODES</str<strong>on</strong>g>Dimensi<strong>on</strong>Physical Availability(public and private)Students andTeachers(for public schools)Available Roomsand FacilityCharacteristics(for public schools)Indicator(s)Number of Facilities per 10,000 populati<strong>on</strong>Distance to the next facilityStudent-Teacher RatiosNumber of Students per ClassShare of permanent / S1 teachersLibrariesLaboratoriesElectrificati<strong>on</strong>Water SourceType and c<strong>on</strong>diti<strong>on</strong> of roof and wallII.2. Methodological ApproachThis secti<strong>on</strong> provides a general overview of the main steps in the analysis, the methodologicalapproach and implementati<strong>on</strong>. More detailed explanati<strong>on</strong>s are given in the technical appendices,while the subsequent chapters <strong>on</strong>ly refer to the main results.The main goal and, at the same time, challenge of this analysis is to use the immense amount ofinformati<strong>on</strong> from the <str<strong>on</strong>g>PODES</str<strong>on</strong>g> data for a reliable and accessible descripti<strong>on</strong> of the state of villageinfrastructure in Ind<strong>on</strong>esia. On the <strong>on</strong>e hand, we aim for a comprehensive breakdown of thedifferent aspects of local service supply; <strong>on</strong> the other hand, we intend to c<strong>on</strong>dense the availableinformati<strong>on</strong> into a summary indicator that allows for an easy grasp of the overall situati<strong>on</strong>. Theanalysis of infrastructure supply readiness therefore c<strong>on</strong>sists of three main phases: (i) identificati<strong>on</strong>of the main indicators and analysis of the geographical distributi<strong>on</strong> of these indicators; (ii)c<strong>on</strong>structing a composite index based <strong>on</strong> the selected indicators; and, (iii) quantifying supply gaps,and translating these supply gaps into estimates of the total financial gap.Selecti<strong>on</strong> of the main indicatorsThe data from both the <str<strong>on</strong>g>PODES</str<strong>on</strong>g> core census and the infrastructure census are combined to make useof all the informati<strong>on</strong> available. Therefore, the facility-level informati<strong>on</strong> from the infrastructurecensus is first transformed into village-level indicators, and then merged with the Core data into asingle dataset. These indicators of local health, educati<strong>on</strong> and transportati<strong>on</strong> infrastructure can be5