PODES Infrastructure Census 2011 Report on ... - psflibrary.org
PODES Infrastructure Census 2011 Report on ... - psflibrary.org
PODES Infrastructure Census 2011 Report on ... - psflibrary.org

Create successful ePaper yourself
Turn your PDF publications into a flip-book with our unique Google optimized e-Paper software.
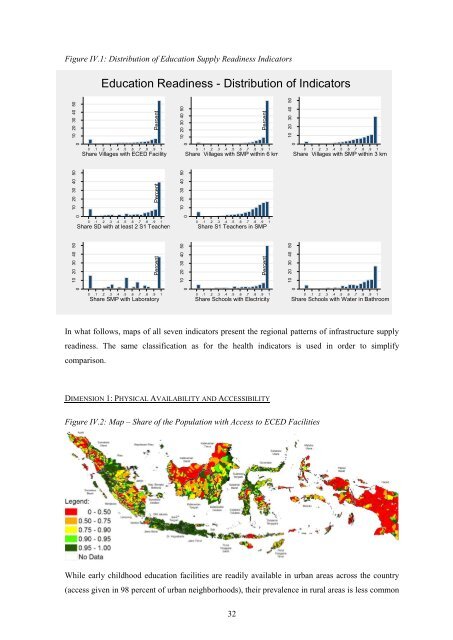
PercentPercentPercent10 20 30 40 5010 20 30 40 5010 20 30 40 50000PercentPercentPercent10 20 30 40 5010 20 30 40 5010 20 30 40 50000PercentPercent10 20 30 40 5010 20 30 40 5000Figure IV.1: Distributi<strong>on</strong> of Educati<strong>on</strong> Supply Readiness IndicatorsEducati<strong>on</strong> Readiness - Distributi<strong>on</strong> of Indicators0 .1 .2 .3 .4 .5 .6 .7 .8 .9 1Share Villages with ECED Facility0 .1 .2 .3 .4 .5 .6 .7 .8 .9 1Share Villages with SMP within 6 km0 .1 .2 .3 .4 .5 .6 .7 .8 .9 1Share Villages with SMP within 3 km0 .1 .2 .3 .4 .5 .6 .7 .8 .9 1Share SD with at least 2 S1 Teachers0 .1 .2 .3 .4 .5 .6 .7 .8 .9 1Share S1 Teachers in SMP0 .1 .2 .3 .4 .5 .6 .7 .8 .9 1Share SMP with Laboratory0 .1 .2 .3 .4 .5 .6 .7 .8 .9 1Share Schools with Electricity0 .1 .2 .3 .4 .5 .6 .7 .8 .9 1Share Schools with Water in BathroomIn what follows, maps of all seven indicators present the regi<strong>on</strong>al patterns of infrastructure supplyreadiness. The same classificati<strong>on</strong> as for the health indicators is used in order to simplifycomparis<strong>on</strong>.DIMENSION 1: PHYSICAL AVAILABILITY AND ACCESSIBILITYFigure IV.2: Map – Share of the Populati<strong>on</strong> with Access to ECED FacilitiesWhile early childhood educati<strong>on</strong> facilities are readily available in urban areas across the country(access given in 98 percent of urban neighborhoods), their prevalence in rural areas is less comm<strong>on</strong>32