PODES Infrastructure Census 2011 Report on ... - psflibrary.org
PODES Infrastructure Census 2011 Report on ... - psflibrary.org
PODES Infrastructure Census 2011 Report on ... - psflibrary.org

You also want an ePaper? Increase the reach of your titles
YUMPU automatically turns print PDFs into web optimized ePapers that Google loves.
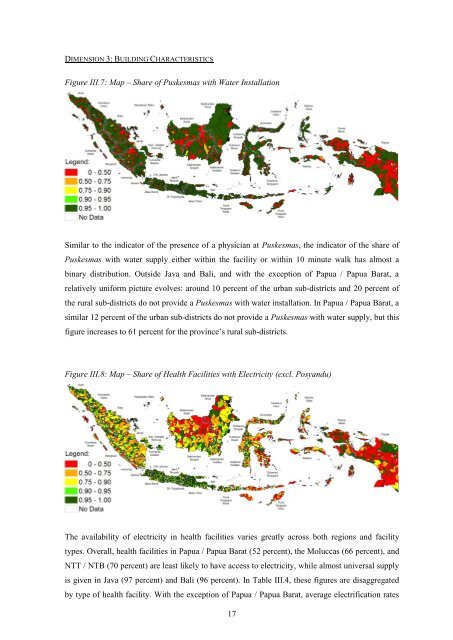
DIMENSION 3: BUILDING CHARACTERISTICSFigure III.7: Map – Share of Puskesmas with Water Installati<strong>on</strong>Similar to the indicator of the presence of a physician at Puskesmas, the indicator of the share ofPuskesmas with water supply either within the facility or within 10 minute walk has almost abinary distributi<strong>on</strong>. Outside Java and Bali, and with the excepti<strong>on</strong> of Papua / Papua Barat, arelatively uniform picture evolves: around 10 percent of the urban sub-districts and 20 percent ofthe rural sub-districts do not provide a Puskesmas with water installati<strong>on</strong>. In Papua / Papua Barat, asimilar 12 percent of the urban sub-districts do not provide a Puskesmas with water supply, but thisfigure increases to 61 percent for the province’s rural sub-districts.Figure III.8: Map – Share of Health Facilities with Electricity (excl. Posyandu)The availability of electricity in health facilities varies greatly across both regi<strong>on</strong>s and facilitytypes. Overall, health facilities in Papua / Papua Barat (52 percent), the Moluccas (66 percent), andNTT / NTB (70 percent) are least likely to have access to electricity, while almost universal supplyis given in Java (97 percent) and Bali (96 percent). In Table III.4, these figures are disaggregatedby type of health facility. With the excepti<strong>on</strong> of Papua / Papua Barat, average electrificati<strong>on</strong> rates17