PODES Infrastructure Census 2011 Report on ... - psflibrary.org
PODES Infrastructure Census 2011 Report on ... - psflibrary.org
PODES Infrastructure Census 2011 Report on ... - psflibrary.org

Create successful ePaper yourself
Turn your PDF publications into a flip-book with our unique Google optimized e-Paper software.
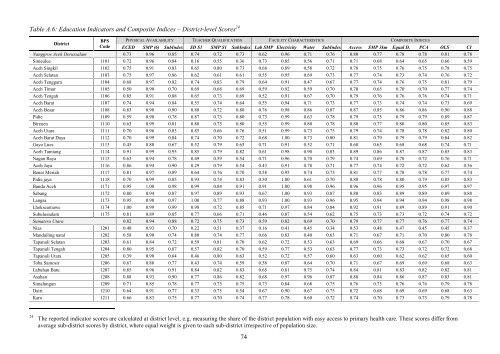
Table A.6: Educati<strong>on</strong> Indicators and Composite Indices – District-level Scores 24DistrictBPS PHYSICAL AVAILABILITY TEACHER QUALIFICATION FACILITY CHARACTERISTICS COMPOSITE INDICESCode ECED SMP (6) SubIndex SD S1 SMP S1 SubIndex Lab SMP Electricity Water SubIndex Access SMP 3km Equal D. PCA OLS CINanggroe Aceh Derussalam 0.73 0.96 0.85 0.74 0.72 0.73 0.62 0.96 0.71 0.76 0.80 0.77 0.78 0.78 0.81 0.78Simeulue 1101 0.72 0.96 0.84 0.16 0.55 0.36 0.73 0.85 0.56 0.71 0.71 0.68 0.64 0.65 0.66 0.59Aceh Singkil 1102 0.75 0.91 0.83 0.65 0.80 0.73 0.68 0.89 0.58 0.72 0.78 0.75 0.76 0.75 0.78 0.75Aceh Selatan 1103 0.75 0.97 0.86 0.62 0.61 0.61 0.55 0.95 0.69 0.73 0.77 0.74 0.73 0.74 0.76 0.72Aceh Tenggara 1104 0.68 0.97 0.82 0.74 0.83 0.79 0.64 0.91 0.47 0.67 0.77 0.74 0.76 0.75 0.81 0.79Aceh Timur 1105 0.50 0.90 0.70 0.69 0.68 0.69 0.59 0.92 0.59 0.70 0.70 0.65 0.70 0.70 0.77 0.74Aceh Tengah 1106 0.85 0.91 0.88 0.65 0.73 0.69 0.52 0.91 0.67 0.70 0.79 0.76 0.76 0.76 0.74 0.71Aceh Barat 1107 0.74 0.94 0.84 0.55 0.74 0.64 0.55 0.94 0.71 0.73 0.77 0.73 0.74 0.74 0.73 0.69Aceh Besar 1108 0.83 0.98 0.90 0.88 0.72 0.80 0.76 0.98 0.86 0.87 0.87 0.85 0.86 0.86 0.90 0.88Pidie 1109 0.59 0.98 0.78 0.87 0.73 0.80 0.73 0.99 0.63 0.78 0.79 0.75 0.79 0.79 0.89 0.87Bireuen 1110 0.63 0.99 0.81 0.88 0.73 0.80 0.55 0.99 0.80 0.78 0.80 0.77 0.80 0.80 0.85 0.83Aceh Utara 1111 0.70 0.96 0.83 0.85 0.66 0.76 0.51 0.99 0.73 0.75 0.79 0.74 0.78 0.78 0.82 0.80Aceh Barat Daya 1112 0.70 0.99 0.84 0.74 0.70 0.72 0.68 1.00 0.73 0.80 0.81 0.79 0.79 0.79 0.84 0.82Gayo Lues 1113 0.45 0.88 0.67 0.52 0.79 0.65 0.71 0.91 0.52 0.71 0.68 0.65 0.68 0.68 0.74 0.71Aceh Tamiang 1114 0.91 0.99 0.95 0.85 0.79 0.82 0.61 0.98 0.90 0.83 0.89 0.86 0.87 0.87 0.85 0.83Nagan Raya 1115 0.63 0.94 0.78 0.49 0.59 0.54 0.71 0.96 0.70 0.79 0.74 0.69 0.70 0.72 0.76 0.71Aceh Jaya 1116 0.86 0.94 0.90 0.29 0.79 0.54 0.43 0.91 0.78 0.71 0.77 0.74 0.72 0.72 0.62 0.56Bener Meriah 1117 0.81 0.97 0.89 0.64 0.76 0.70 0.58 0.95 0.74 0.75 0.81 0.77 0.78 0.78 0.77 0.74Pidie jaya 1118 0.70 0.99 0.85 0.93 0.74 0.83 0.50 1.00 0.61 0.70 0.80 0.78 0.80 0.79 0.85 0.83Banda Aceh 1171 0.95 1.00 0.98 0.99 0.84 0.91 0.91 1.00 0.98 0.96 0.96 0.96 0.95 0.95 0.97 0.97Sabang 1172 0.80 0.94 0.87 0.97 0.89 0.93 0.67 1.00 0.93 0.87 0.88 0.83 0.89 0.89 0.89 0.88Langsa 1173 0.95 0.98 0.97 1.00 0.77 0.88 0.93 1.00 0.93 0.96 0.95 0.94 0.94 0.94 0.98 0.98Lhokseumawe 1174 1.00 0.99 0.99 0.98 0.72 0.85 0.71 0.97 0.84 0.84 0.92 0.91 0.89 0.89 0.91 0.90Subulussalam 1175 0.81 0.89 0.85 0.77 0.66 0.71 0.46 0.87 0.54 0.62 0.75 0.73 0.73 0.72 0.74 0.72Sumatera Utara 0.82 0.94 0.88 0.72 0.75 0.73 0.59 0.82 0.69 0.70 0.79 0.77 0.77 0.76 0.77 0.74Nias 1201 0.48 0.93 0.70 0.22 0.51 0.37 0.16 0.41 0.45 0.34 0.53 0.48 0.47 0.45 0.45 0.37Mandailing natal 1202 0.58 0.90 0.74 0.80 0.74 0.77 0.66 0.83 0.40 0.63 0.71 0.67 0.71 0.70 0.80 0.78Tapanuli Selatan 1203 0.61 0.84 0.72 0.59 0.81 0.70 0.62 0.72 0.53 0.63 0.69 0.66 0.68 0.67 0.70 0.67Tapanuli Tengah 1204 0.80 0.95 0.87 0.57 0.82 0.70 0.59 0.77 0.53 0.63 0.77 0.73 0.73 0.72 0.72 0.68Tapanuli Utara 1205 0.39 0.90 0.64 0.46 0.80 0.63 0.52 0.72 0.57 0.60 0.63 0.60 0.62 0.62 0.65 0.60Toba Samosir 1206 0.67 0.88 0.77 0.43 0.74 0.59 0.58 0.87 0.64 0.70 0.71 0.67 0.69 0.69 0.68 0.63Labuhan Batu 1207 0.85 0.96 0.91 0.84 0.82 0.83 0.65 0.81 0.75 0.74 0.84 0.81 0.83 0.82 0.82 0.81Asahan 1208 0.88 0.93 0.90 0.77 0.86 0.82 0.68 0.97 0.96 0.87 0.88 0.84 0.86 0.87 0.83 0.81Simalungun 1209 0.71 0.85 0.78 0.77 0.73 0.75 0.73 0.84 0.68 0.75 0.76 0.73 0.76 0.76 0.79 0.78Dairi 1210 0.64 0.91 0.77 0.33 0.75 0.54 0.67 0.90 0.67 0.75 0.72 0.68 0.69 0.69 0.68 0.63Karo 1211 0.66 0.83 0.75 0.77 0.70 0.74 0.77 0.78 0.60 0.72 0.74 0.70 0.73 0.73 0.79 0.7824The reported indicator scores are calculated at district level, e.g. measuring the share of the district populati<strong>on</strong> with easy access to primary health care. These scores differ fromaverage sub-district scores by district, where equal weight is given to each sub-district irrespective of populati<strong>on</strong> size.74