Appendix 2: Alternative Indicators of Health Pers<strong>on</strong>nelFor comparis<strong>on</strong>, the following four populati<strong>on</strong>-based indicators of health workforce are brieflydescribed: Number of Physicians per 10,000 Populati<strong>on</strong> [Target: 1 Physician per 10,000]Number of Midwives per 10,000 Populati<strong>on</strong>Number of Nurses per 10,000 Populati<strong>on</strong> Number of Core Medical Professi<strong>on</strong>als (Physicians, Midwives, Nurses)per 10,000 Populati<strong>on</strong> [WHO Target: 23]Table A.1 provides descriptive statistics for the six indicators. In the average sub-district, 1.6physicians, 7.2 midwives, and 9.5 nurses are available per 10,000 inhabitants, which results in 18.3core health professi<strong>on</strong>als per 10,000 populati<strong>on</strong>. We calculate score indicators for the availabilityof physicians and core health professi<strong>on</strong>als, using 1 physician and 23 core health professi<strong>on</strong>als per10,000 populati<strong>on</strong> as target, respectively. Table A.2 reports the correlati<strong>on</strong>s between thepopulati<strong>on</strong>-based indicators and the seven core indicators selected for the index. The c<strong>on</strong>sistentlyinsignificant or negative correlati<strong>on</strong>s point to a structurally different picture of health servicesupply that is obtained from populati<strong>on</strong>-based indicators, as compared to the results from all sevencore indicators of health supply readiness.Table A.1: Alternative Health Pers<strong>on</strong>nel Indicators: Descriptive StatisticsDescriptives n Mean SD Min MaxPhysicians per 10,000 Populati<strong>on</strong> 6771 1.6 2.7 0 52.1Midwives per 10,000 Populati<strong>on</strong> 6771 7.2 7.0 0 208.5Nurses per 10,000 Populati<strong>on</strong> 6771 9.5 13.1 0 300.8Core Medical Professi<strong>on</strong>als per 10,000 Pop. 6771 18.3 17.9 0 433.2Core Medical Professi<strong>on</strong>als Score (23=100) 6771 0.621 0.289 0 1Physicians Score (max=1) * 6771 0.637 0.415 0 1The Physicians Score takes <strong>on</strong> the value 1 for sub-districts that fulfill the target of 1 physician per 10,000 populati<strong>on</strong>. In this special case,the indicator represents a truncated versi<strong>on</strong> of the Physicians per 10,000 populati<strong>on</strong> indicator.Table A.2: Alternative Health Pers<strong>on</strong>nel Indicators: Correlati<strong>on</strong>s of with Core IndicatorsCorrelati<strong>on</strong> with the otherIndex-VariablesPrimary Sec<strong>on</strong>dary Delivery Physician Midwife Water Electr.Physicians per 10,000 Pop. 0.07 0.11 0.07 0.16 0.02 0.08 0.10Midwives per 10,000 Pop. 0.03 -0.13 -0.04 -0.03 0.05 -0.05 -0.04Nurses per 10,000 Pop. -0.08 -0.31 -0.21 -0.13 -0.30 -0.09 -0.17Core Medical Pro’s per 10,000 -0.04 -0.26 -0.16 -0.09 -0.20 -0.08 -0.12Core Medical Pro’s; Score 0.06 -0.23 -0.08 -0.02 -0.16 -0.02 -0.12Physicians; Score 0.26 0.24 0.27 0.42 0.24 0.27 0.2456
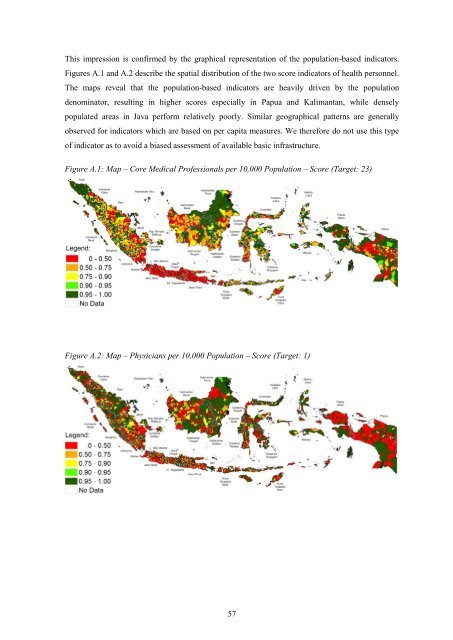
This impressi<strong>on</strong> is c<strong>on</strong>firmed by the graphical representati<strong>on</strong> of the populati<strong>on</strong>-based indicators.Figures A.1 and A.2 describe the spatial distributi<strong>on</strong> of the two score indicators of health pers<strong>on</strong>nel.The maps reveal that the populati<strong>on</strong>-based indicators are heavily driven by the populati<strong>on</strong>denominator, resulting in higher scores especially in Papua and Kalimantan, while denselypopulated areas in Java perform relatively poorly. Similar geographical patterns are generallyobserved for indicators which are based <strong>on</strong> per capita measures. We therefore do not use this typeof indicator as to avoid a biased assessment of available basic infrastructure.Figure A.1: Map – Core Medical Professi<strong>on</strong>als per 10,000 Populati<strong>on</strong> – Score (Target: 23)Figure A.2: Map – Physicians per 10,000 Populati<strong>on</strong> – Score (Target: 1)57