
Create successful ePaper yourself
Turn your PDF publications into a flip-book with our unique Google optimized e-Paper software.
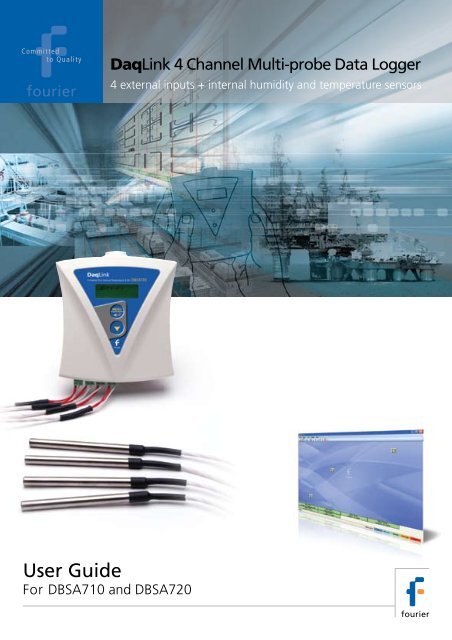
Committedto Quality<strong>DaqLink</strong> 4 Channel Multi-probe Data Logger4 external inputs + internal humidity and temperature sensors<strong>User</strong> <strong>Guide</strong>For DBSA710 and DBSA720
<strong>DaqLink</strong><strong>User</strong> <strong>Guide</strong>Supporting <strong>DaqLink</strong> v1.2.2.1November 2009© Fourier Systems Ltd.
Contacting Fourier Systems technical support:Email: support@fouriersystems.comWeb: www.fouriersystems.com/support/contact_support.phpTelephone: USA 1-866-771-6682 (toll-free within USA only)For Troubleshooting and FAQs visit the website at:http://www.fouriersystems.com/support/faq/To download updated versions of the <strong>DaqLink</strong> <strong>User</strong> <strong>Guide</strong>and <strong>DaqLink</strong> software/firmware visit:www.fouriersystems.com/support/download_center.php.Information in this document is subject to change withoutnotice.© 2009 Fourier Systems Ltd. All rights reserved.Reproduction of this document in any manner without the priorwritten consent of Fourier Systems Ltd. is strictly forbidden.
Table of ContentsCHAPTER 1: DAQLINK OVERVIEW 11.1. <strong>DaqLink</strong> Introduction 11.2. The <strong>DaqLink</strong> System 21.2.1. The Data Logger 31.2.2. Hardware Accessories 41.2.3. <strong>DaqLink</strong> Software 5CHAPTER 2: DAQLINK IMPLEMENTATION GUIDE 62.1. Pre-setup Requirements 62.2. Launching the Software 72.3. Connecting the Logger 82.4. Charging <strong>DaqLink</strong> Loggers 92.5. Loading Map View Background 102.6. Configuring the Logger 112.7. Viewing Data 132.7.1. Online Data Views 132.7.2. Logger Tooltip 152.7.3. Sensor View 152.8. Downloading Data 16CHAPTER 3: DAQLINK HARDWARE OVERVIEW 173.1. Data Logger Front Panel Layout 173.1.1. DBSA710 and DBSA720 17
3.2. Data Logger External Connections 183.2.1. DBSA710 and DBSA720 183.3. Data Logger Sensor Overview 193.3.1. Internal Sensor Types 193.3.2. External Sensor Types 203.3.3. Sensor Connection 213.3.4. External PT-100 Sensor Connection 223.3.5. Programming Limitations for DBSA710 andDBSA720 223.3.6. External Alarm Output 233.3.7. Polarity 253.3.8. Frequency/Pulse Counter 253.3.9. <strong>User</strong> Defined Sensors 253.3.10. Sensor Alarms 263.3.11. Sensor Calibration 263.4. Unit Serial Number and Comment 273.5. Power Supply 273.5.1. DBSA710 and DBSA720 Data Loggers 273.5.2. Power Adapter 293.5.3. Data Logger Battery Life 293.6. USB Communication Cable 293.7. <strong>DaqLink</strong> Keypad Overview 303.7.1. DBSA710 and DBSA720 Keypad 303.8. Operating the DBSA710 and DBSA720 313.8.1. Turning on the Unit 313.8.2. Display Shutdown 323.8.3. Main Menu Options 323.8.4. Additional Logger Screens 36CHAPTER 4: USING THE DAQLINK SOFTWARE 384.1. Installing <strong>DaqLink</strong> Software 38
4.1.1. System Requirements 384.1.2. Installation Procedure 394.1.3. Installation Troubleshooting 424.2. <strong>DaqLink</strong> Software Layout 424.2.1. Map View 434.2.2. Viewing Sensor Data in Map View 444.2.3. History View 454.2.4. Data Map 464.2.5. <strong>DaqLink</strong> Toolbar Icons 474.3. File Menu Items 524.3.1. Open 524.3.2. Open Project File 524.3.3. Save Project 534.3.4. Save Project As 534.3.5. Exit 534.4. Logger Menu Items 534.4.1. Display Data 534.4.2. Download Data 534.4.3. Cancel Download 544.4.4. Reset Alarm 544.4.5. Calibration 544.4.6. Cancel Firmware Update 544.4.7. Setup 554.4.8. Stop 554.4.9. Run 554.4.10. Detect Logger 554.5. Tools Menu Items 554.5.1. Define Sensor 554.5.2. Lock Map View 574.5.3. Options Menu 574.5.4. Email Alarm Notifications 574.5.5. SMS Alarm Notifications 574.6. Tools > Options Menu Items 584.6.1. Preferences Tab 58
4.6.2. Email Settings Tab 604.6.3. SMS Settings Tab 614.6.4. Analysis Menu Items 634.7. Saving Data 644.8. Viewing Archived (Offline) Data 644.9. Viewing Online Data 664.9.1. Showing/Hiding the Data Sets 684.10. Working in Map View 694.10.1. Loading Map View Wallpaper 694.10.2. Moving Icons around the Screen 694.10.3. Logger Icon Context Menu 704.10.4. Viewing Logger Status 704.11. Configuring the Logger 724.11.1. Device Setup Tab 724.11.2. Alarm Setup Tab 764.12. Alarm Notifications Setup 784.12.1. Contacts Tab 804.12.2. Groups Tab 814.12.3. Notifications Setup Tab 824.12.4. Email and SMS Notification Formats 844.13. Calibration 854.13.1. Introduction to <strong>DaqLink</strong> Calibration 864.13.2. Calibrating the Data Logger 884.13.3. Performing a Two-point Calibration 894.13.4. Performing an Offset Calibration 914.13.5. Setting the Offset to a Specific Input 914.13.6. Calibrating the Internal Temperature Sensor onthe DBSA910 924.13.7. Calibrating the External PT-100 Sensor Input 924.13.8. Saving Calibration Settings 934.13.9. Loading Calibration Settings 93
4.14. Analyzing the Data 934.14.1. Using the Graph Features 944.14.2. Statistical Analysis 1004.15. Exporting Data to Excel or CSV Formats 1004.16. Printing the Data 1014.17. System Password 102CHAPTER 5:UPDATING DAQLINK SOFTWARE ANDFIRMWARE 1045.1. Using the Uptodata Client 1045.2. Updating <strong>DaqLink</strong> Firmware 1075.2.1. Downloading the Firmware File 1075.2.2. Firmware Update from the Map View Icon 108APPENDIX A: DAQLINK SPECIFICATIONS 109A.1. Data Logger Input Types 109A.2. DBSA710 and DBSA720 Outputs 110A.3.Logger Input Specifications DBSA710 andDBSA720 110A.4. General Specifications 112A.5. System Requirements 113APPENDIX B: SAFETY INFORMATION 114APPENDIX C: ORDERING INFORMATION 116
APPENDIX D: FIGURES AND TABLES 118
Chapter 1:<strong>DaqLink</strong> OverviewThis chapter provides a general overview of the <strong>DaqLink</strong>system.1.1. <strong>DaqLink</strong> IntroductionLight, Portable and Independent LoggingWith built-in temperature and humidity sensors, plus fourexternal probe inputs the <strong>DaqLink</strong> standalone data loggerensures a low cost, reliable and accurate solution. The<strong>DaqLink</strong> logger is a 16-bit, mobile data acquisition device forcontinuous indoor or outdoor data monitoring.The <strong>DaqLink</strong> system is comprised of two data logger models,measuring a broad range of parameters on four externalinputs for direct measurement and recording of PT-100,thermocouple, 0 to 1 V, 4 to 20 mA, contact, frequency andpulse sensors, as well as internal temperature and relativehumidity sensors.With its high resolution and fast Analog to Digital converter(ADC), <strong>DaqLink</strong> data loggers meet the majority of dataacquisition requirements in most industrial applications. Every<strong>DaqLink</strong> logger unit is embedded with a unique serial numberand can be loaded with a descriptive comment for safeidentification. An internal clock and calendar keeps track of thetime and date of every sample measured.<strong>DaqLink</strong> loggers can automatically activate external alarmevents when data is outside a specified range. Email and SMSnotifications can be sent to predefined contacts.1
The <strong>DaqLink</strong> system is powered by the powerful <strong>DaqLink</strong>software. The Windows based software is the centralmanagement interface of the <strong>DaqLink</strong> network. Whenconnected via USB cable to the PC, <strong>DaqLink</strong> data can bemonitored online and displayed in real-time graphs or tables.Analyze data with various mathematical tools, or export datato a spreadsheet.The software also enables you to configure, calibrate orupdate the firmware of <strong>DaqLink</strong> units via direct USBconnection.Key <strong>DaqLink</strong> benefits include:• Real-time logging - Online operation with data results onscreen• Independence - Manual or PC operation with on-sitemonitoring via two-row LCD display• Intuitively - Simple keypad and easy-to-navigate menus• Long life - Low-power consumption and rechargeablebattery lasting up to six months• Flexibility - Four alarm levels with visual LCD, and audiblealarms• Non-stop logging - Continuous data storage to largeonboard memory and periodic USB downloads1.2. The <strong>DaqLink</strong> SystemThe basic <strong>DaqLink</strong> system will contain at least one of thefollowing units:• <strong>DaqLink</strong> data logger – Part Number DBSA710 orDBSA720• Mini-USB communication cable• Power adapter (one per <strong>DaqLink</strong> unit ordered)2
• <strong>DaqLink</strong> software CD containing user guide1.2.1. The Data LoggerThere are two data logger models compatible with the<strong>DaqLink</strong> system. These loggers support up to four externalsensors and two internal sensors, temperature and humidity,depending on the specific model. Data is recorded and storedto the logger’s internal memory and transmitted over thenetwork to the <strong>DaqLink</strong> software running on the PC.The data logger is programmed to consume as little power aspossible during operation, in order to conserve the battery life.When not transmitting or recording data the units are in sleepmode and they wake up when needed.The battery for the DBSA710 and DBSA720 is rechargeableand can run up to several months on one charge, dependingon the logger configuration.Refer to section 3.5.3 for more information.Note: Battery life depends on the logger sampling rate,transmission rate, type of sensor, and number of measuredsensors.3
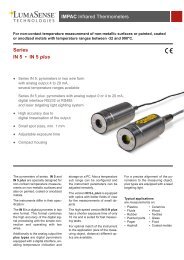
<strong>DaqLink</strong> Data LoggersPart Number: DBSA720Four external channel data logger withtwo internal sensors, Humidity andTemperatureMemory Capacity: ~59,000 samplesPower supply: AC or battery operatedPart Number: DBSA710Four external channel data logger withinternal Temperature sensorMemory Capacity: ~59,000 samplesPower supply: AC or battery operated1.2.2. Hardware AccessoriesThe <strong>DaqLink</strong> system includes the following accessories:• Mini-USB cable for connecting data logger to PC• Power adapter to power the data logger4
1.2.3. <strong>DaqLink</strong> SoftwareThe user interface for the <strong>DaqLink</strong> system, the <strong>DaqLink</strong>software CD is provided together with the <strong>DaqLink</strong> hardwareand includes the following features:• Data display, management, storage and data diagnostics• Alarm settings: Email and SMS notifications, visual andaudible alarms• Sensor definition• Sensor calibration• Firmware update• Automatic software update (via Fourier server)The software interface is described in detail in Chapter 4.5
Chapter 2:<strong>DaqLink</strong>Implementation <strong>Guide</strong>Fourier Systems suggests first time users of the <strong>DaqLink</strong>system read this chapter before drilling down into the manyfeatures of the system described later in the user guide. TheImplementation <strong>Guide</strong> will give you a clear understanding ofthe basic aspects of setting up the system, and getting thedata logger up and running.2.1. Pre-setup RequirementsPrior to commencing with the <strong>DaqLink</strong> implementation youmust have the following requirements in place:PC• 24/7 availability, if online data monitoring is required• Reliable AC power• Sufficient hard disk space to store loggers’ data• One free USB port<strong>DaqLink</strong> devicesAt least one <strong>DaqLink</strong> logger DBSA710 or DBSA720Mini-USB cableThe mini-USB cable connects the data logger to the PC forlogger configuration and data download (and is supplied withthe PC Suite software kit).6
2.2. Launching the Software1. Install the <strong>DaqLink</strong> software on the PC workstation. Referto section 4.1: Installing <strong>DaqLink</strong> Software on page 38 formore details.2. Once the software and associated components havebeen installed, launch <strong>DaqLink</strong> from your <strong>DaqLink</strong>desktop shortcut .3. The main <strong>DaqLink</strong> window is launched. The default viewis called Map View.Figure 1: Main <strong>DaqLink</strong> window7
4. Check for <strong>DaqLink</strong> updates. Go to Help > Check forUpdates from the <strong>DaqLink</strong> main menu to check for newerversions of <strong>DaqLink</strong> software and firmware released sinceyou purchased your system. For more details on theUpdate feature go to Chapter 5: Updating <strong>DaqLink</strong>Software and Firmware.2.3. Connecting the LoggerNote: Only one <strong>DaqLink</strong> logger will be detected by the PC ata time.1. Only once the <strong>DaqLink</strong> software and USB driver havebeen installed, connect the <strong>DaqLink</strong> data logger(DBSA710 or DBSA720) to the Fourier-supplied poweradapter.Note: Only use adapters provided by Fourier Systems. Use ofthe wrong adapter could damage your <strong>DaqLink</strong> units.2. Turn on the unit by pressing the Scroll button onthe front keypad. The unit will beep when turned on.3. Connect the mini-USB cable to the computer and to thedata logger’s mini-USB port.4. From the <strong>DaqLink</strong> main menu, go to Logger > DetectLogger. The data logger icon will appear in the Map Viewindicating that the logger is detected.8
Figure 2: Adding data logger icon to Map ViewNote: If the logger is not recognized by the software tryconnecting the mini-USB cable to another USB port on thePC. Or select Logger > Detect Logger again in the mainmenu.Should you disconnect the logger’s USB cable or poweradapter (and the battery eventually dies), the logger iconwill be grayed out:Note: You can move the logger icon elsewhere on the screenby going to Tools > Lock Map View and unselecting thisoption.2.4. Charging <strong>DaqLink</strong> LoggersThis section refers to charging the DBSA710 or DBSA720loggers.Note: Only use adapters provided by Fourier Systems. Use ofthe wrong adapter could damage your <strong>DaqLink</strong> units.If the loggers will run from the battery supply make sure to firstcharge each of the loggers for 16 hours before use in ordermaximize the battery life. A fully charged battery can lastseveral months, depending on your logger configuration.9
If the loggers will run from the AC power supply, when firstconnected to the AC adapter the logger will always initiate the16 hour charge cycle.Note: For loggers measuring data with the internaltemperature sensor, it is critical to note that during the chargecycle the logger will heat up thereby causing the internaltemperature sensor reading to rise up to 10 ˚C above ambienttemperature. Once the charging process is complete, thelogger will cool down and the internal temperature sensorreadings will return to normal.For loggers remaining connected to AC power, to prevent thelogger from heating up again following the initial charge cycle,the logger will receive a one minute trickle charge each dayrather than stay continually charged. This is sufficient toensure the logger doesn’t self-discharge and will maintain thelogger’s full charge status.Refer to section 3.5.1 for more details on the <strong>DaqLink</strong> loggers’power supply.2.5. Loading Map ViewBackgroundLoad an image into the <strong>DaqLink</strong> software showing a map ofyour facility in order to place the Logger icons in their relativepositions. As you deploy more standalone loggers, this willprove very helpful.• Double click the Map View background to browse to theimage directory and load the image. Remember to unlockthe Map View in order to move the icons around.• Right-click the Map View background and two options willbe available: Load Wallpaper and Reset Wallpaper,which resets to the default Fourier wallpaper.10
2.6. Configuring the LoggerOnce the software has detected the <strong>DaqLink</strong> logger, you mustconfigure the unit in order to start acquiring data.5. Right-click on the Logger icon. Select Setup from thecontext menu.The Setup window will be launched.Figure 3: Logger Setup windowThis dialog provides non-editable information such as theserial number, battery level, and firmware version of thecurrent unit.11
On the Device Setup and Alarm Setup tabs, the user isable to configure the following parameters:• Unit's comment• Sampling rate• Memory State• Averaging points• Temperature units °C/°F (on the logger LCD)• Anti-tamper mode• Active sensors• Custom sensors' names• Alarm levels• Alarm duration• Alarm delay• Alarm pre delay6. Select the Memory State, Online or Optimized MemoryModes.7. Select the sensors you wish to connect to the logger fordata acquisition. It doesn’t matter which order you selectthe sensors. You may only have Input 4 selected, forexample, and Inputs 1 to 3 left unselected.8. Select the sampling rate anywhere from 1 every secondto 1 every 18 hours.9. Unless you have Alarm levels you wish to edit (see theAlarms Setup tab), click either Setup and Run (to sendthe setup and immediately log data), or Setup Only (tosend the setup but only log data at your command).10. If you selected Setup Only in step 5, right-click theLogger icon and select Run from the context menu tostart logging data or click in the main tool bar.12
The Logger icon will appear as follows when in Runmode: .11. To stop the logger, right-click the Logger icon and selectStop from the context menu.Note: Running the logger clears the logger memory. Allpreviously recorded data will be erased when you begin a newlogging session.2.7. Viewing DataOnce you run the logger, you have several ways of viewingthe online data that is being acquired.• Online graph/table/statistics views• Logger icon tooltip• Sensor view2.7.1. Online Data ViewsDouble clicking the Logger icon or selecting Display Data inthe Logger icon context menu will open the online graph.This graph is updated in real-time with the newly recordeddata.You can switch between Graph, Table and Statistics views toview the data in different formats.13
Figure 4: Online data – Graph viewFigure 5: Online data – Table viewFigure 6: Online data – Statistics view14
2.7.2. Logger TooltipClose the online data window and return to Map View. Scrollover the Logger icon and you will see a tooltip displaying therelevant logger information, including real-time data.Figure 7: Logger tooltipThis tool-tip is updated with every newly recorded sample.2.7.3. Sensor ViewYou can monitor data by viewing the data display of eachindividual sensor, rather than using the Graph or Table views.When the logger is running, the individual sensor data isdisplayed in a box in the bottom pane of the main Map View.Figure 8: Sensor view• If the sensor is in alarm, the sensor box will change colorfrom green to red (just as the Logger icon would).15
• Double-clicking the individual sensor box will open thedata in the online Graph view.2.8. Downloading DataIf the logger is being used as a standalone device you willhave to connect it to the computer via USB cable in order todownload the data to the software.1. Connect logger to PC and go to Logger > Detect Loggerin the main menu.2. To download data:• Click the Download icon in the upper toolbar, or• Go to Logger > Download Logger, or• Right-click the logger icon and select Download Data3. View the downloaded data by double-clicking the loggericon.16
Chapter 3:<strong>DaqLink</strong> HardwareOverviewThis chapter details the hardware features of the <strong>DaqLink</strong>data loggers.3.1. Data Logger Front PanelLayout3.1.1. DBSA710 and DBSA720Apart from the color scheme, the DBSA710 and DBSA720data logger models have the same front panel design.LCD screenMenu/Enter buttonScroll buttonFigure 9: DBSA710 data logger front panelLCD screenDisplays logger status, logger data, and Min/Max values.17
Menu/Enter buttonUse to enter logger menu options and to execute loggercommands.Scroll buttonUse to scroll though menu items and to power on unit.3.2. Data Logger ExternalConnections3.2.1. DBSA710 and DBSA720External connections of the DBSA710 and DBSA720 areexactly the same.Mini USB port12 V power socketNegative CenterFour sensorExcitationinputsFigure 10: DBSA720 data logger external connectionsMini USB PortTo enable communication between logger and PC, forconfiguration and data download.12 V Power Socket18
To connect logger to external power supply (negative center).Sensor InputsPluggable screw terminal blocks marked In-1 to In-4 (from left toright), to connect wide range of sensor types for data acquisition.All four inputs can be used simultaneously. Sensors can beconnected in any order.To connect a sensor to the <strong>DaqLink</strong> data logger, unplug thescrew terminal, connect the sensor’s wires to the terminals, andthen plug the terminal back to the corresponding socket on theinput block.Excitation socketOutput power socket used to power external sensors, powerderived directly from the external power supply adaptor.3.3. Data Logger SensorOverviewThis section provides an overview of the hardwarespecifications of the <strong>DaqLink</strong> data loggers.3.3.1. Internal Sensor TypesThe DBSA710 and DBSA720 loggers include internalsensors, depending on the logger model.SensorMeasurementRangeDigital Humidity 5% to 95%Accuracy±3% (in <strong>DaqLink</strong>software)±4% (on logger LCD)LoggerModelDBSA72019
SensorMeasurementRangeAccuracyLoggerModelDigital Temperature -20 ºC to 50 ºC ±0.5 ºC DBSA720TemperaturePT100-20 ºC to 50 ºC ±0.3 ºC DBSA7103.3.2. External Sensor TypesDBSA710 and DBSA720Each of the four input channels of these data logger modelsare multi-purpose and can be individually configured to any ofthe following types and ranges.Sensor MeasurementRangeAccuracy AvailableInputsCurrent 4 to 20 mA ± 0.5 % In-1 to In-4Contact Open (0) /N/AIn-1 to In-4Close (1)Frequency 20 Hz to 4 KHz N/A In-4 onlyPulse Counter 1 to 65,536 pulses N/AIn-4 only0 to 4 KHzTemperature -200 to 400 ºC -200 to -60 ºC ±0.5 % In-1 to In-4PT100 (2-wire)-60 to 60 ºC ±0.3 ˚C60 to 400 ºC ±0.5 %Temperature TC-J -200 ºC to 1,000 ºC -200 to -60 ºC ±0.5 % In-1 to In-4-60 to 60 ºC ±0.5 ˚C60 to 1,000 ºC ±0.5 %Temperature TC-K -200 ºC to 1,000 ºC -200 to -60 ºC ±0.5 % In-1 to In-420
SensorMeasurementRangeAccuracy-60 to 60 ºC ±0.5 ˚C60 to 1,000 ºC ±0.5 %Temperature TC-T -200 ºC to 400 ºC -200 to -60 ºC ±0.5 %-60 to 60 ºC ±0.5 ˚C60 to 400 ºC ±0.5 %AvailableInputsIn-1 to In-4Voltage 0 to 1 V ± 0.5 % In-1 to In-4Voltage 0 to 50 mV ± 0.5 % In-1 to In-43.3.3. Sensor ConnectionConnect the sensor/s to the terminal block/s at the top of datalogger:Figure 11: <strong>DaqLink</strong> logger sensor inputsSensors do not have to be added successively. You may onlyconfigure In-4, or configure In-1 and In-3, for example, whensetting up the logger via the software.21
3.3.4. External PT-100 SensorConnectionThe PT-100 sensor, as supplied by Fourier Systems, comespre-wired to the data logger’s terminal block.The PT-100 positive polarity (red) and ground (white) wiresare connected to the + input of the terminal block. Thenegative polarity (black) wire is connected to the – input onthe terminal block.3.3.5. Programming Limitations forDBSA710 and DBSA720The standard sampling rate for all sensors on all inputs is froma maximum of one sample every second to a minimum of onesample every 18 hours. However, there are certain limitationsusing a specific combination of sensors, which must be takeninto account when programming the <strong>DaqLink</strong> data loggers.Note: The software integrates all programming limitationsautomatically when configuring the loggers.Please refer to the table below for <strong>DaqLink</strong> programminglimitations, where:PT100, Thermocouple J, K or T = AInternal Digital Temperature (on DBSA720) = BSensorCombination3 x A4 x AA + BMaximumSampling RateOne sample everythree secondsExample SetupIn-1: PT-100In-2: TC-JIn-3: TC-J22
SensorCombinationMaximumSampling RateOne sample everyfour secondsExample Setup(2 x A) + B(3 x A) + BInternal: TempIn-1: TC-TIn-2: PT-100(4 x A) + B One sample every Internal: Tempfive secondsIn-1: TC-TIn-2: TC-JIn-3: PT-100In-4: PT-100Table 1: Data Logger programming limitations3.3.6. External Alarm OutputThe <strong>DaqLink</strong> system supports connection of an external alarme.g. siren, audible alarm, to In-1 of the DBSA710 andDBSA720 data loggers.When connected to the logger, the external alarm will beactivated only when that logger is in alarm status.Once there is no alarm status, the external alarm will bedeactivated.Data Logger External AlarmIn-1 of the DBSA710 and DBSA720 serves either as astandard sensor input or as an external alarm output. Ensurethe logger is connected to AC power if connected to anexternal alarm.Configure In-1 as Alarm Normally Open or Alarm NormallyClosed in the logger Setup window in the <strong>DaqLink</strong> software.23
Normally Open will result in the alarm being activated duringalarm status (the circuit will be closed).Normally Closed will result in the alarm being activated whenlogger is not in alarm and therefore deactivated when there isan alarm (the circuit will be opened).Connect In-1 to your external alarm device and connect thelogger to AC power.Use the Alarm Setup tab in the Setup dialog to define thelogger alarm settings. If these settings are breached then thealarm will be activated.External Alarm SchematicSee the schematic below explaining how to hook up anexternal alarm to the <strong>DaqLink</strong> unit.- +- +Relay- +Alarm device(e.g. siren)+-3-4 V batteryto power relayFigure 12: External alarm schematic24
• + from DBSA710/720 goes to – of the Relay inputs• + of Relay input goes to battery that powers the Relay• Load inputs of the Relay go to the Alarm device e.g. siren,lights, etc.• - of the battery goes to – of DBSA710/720.Note: Maximum load of the Relay is 50 mA, 3 V.Refer to Appendix A: <strong>DaqLink</strong> Specifications for the fullexternal alarm output specification.3.3.7. PolarityCurrent, voltage, thermocouples and user defined sensorshave distinct polarity. Be careful to connect them in the rightpolarity.3.3.8. Frequency/Pulse CounterConnect the signal wires to In-4 terminal blocks, and selectFrequency or Pulse counter for Input 4 from the loggerSetup window in the <strong>DaqLink</strong> software. Inputs 1 to 3 are stillavailable for other sensors.The Frequency/Pulse counter is optically isolated from theinternal circuitry and can simultaneously measure a signalsource, together with another input.3.3.9. <strong>User</strong> Defined Sensors<strong>DaqLink</strong> provides a simple and straightforward tool fordefining a limited number of custom sensors. Almost anysensor or transducer with 0 – 1 V or 4 – 20 mA output is25
accepted by the <strong>DaqLink</strong> logger and its electrical units areautomatically scaled to meaningful user-defined engineeringunits.The sensor definitions are stored in the logger’s memory andare added to the sensors list. The sensor’s readings aredisplayed in the user defined units only in the <strong>DaqLink</strong>software. Future versions will also support displaying the userdefined engineering units on the logger LCD.Refer to section 4.5.1 for more details.3.3.10. Sensor AlarmsVia the software, users can define minimum and maximumalarm levels for each input individually. <strong>User</strong>s can define prelowand pre-high alarm levels, for an additional level of safetyin case the logger is approaching an actual breach of alarm.The <strong>DaqLink</strong> logger display indicates when the sensor readingis in alarm of any type. The symbols AL-H, AL-L, AL-P-H orAL-P-L are visible next to the corresponding input readings.Refer to section 4.12 for more details.3.3.11. Sensor CalibrationThe <strong>DaqLink</strong> data logger is shipped fully calibrated. However,further calibration can be applied via the <strong>DaqLink</strong> software.The calibration parameters are sent to the data loggers viaUSB connection and stored in the logger’s memory.<strong>User</strong>s may calibrate individual inputs as well as all inputs atonce. Calibration settings may be saved and then loaded intothe logger at a later date if the calibration settings havechanged.Refer to section 4.12.4 for more details.26
3.4. Unit Serial Number andCommentEvery <strong>DaqLink</strong> data logger unit is embedded with a uniqueserial number.The data logger only can be loaded with a descriptivecomment to identify its task and location. You may add or editthe logger comment via the <strong>DaqLink</strong> software.Every time data is transferred to the computer it is labeledboth with the logger’s serial number and comment and isdisplayed in the graph or data table view.The unit serial number is also marked on a sticker on the backof the product.3.5. Power Supply3.5.1. DBSA710 and DBSA720 DataLoggersThe DBSA710 and DBSA720 data loggers run from aninternal NiMh rechargeable battery as well as from externalAC power supply. Depending on the logger configuration,from a fully charged battery, the data logger can run for up toseveral months. Refer to section 3.5.3 for more details onbattery life.Note: Charge the data logger units for 16 hours before usingthem for the first time.When connected to external power supply, the data loggerbattery will not be charged when the unit is turned off. This willallow the system to protect the battery from overheating.27
First Time ChargingFrom a fully drained battery, you must charge the battery for16 hours to bring it to a full charge. Once the charge cycle iscomplete, the logger will run from the external power supply,without draining (or charging) the internal battery. In order tomaintain a fully charged battery and ensure the batterydoesn’t self-discharge, the battery charger will daily chargethe unit for one minute to maintain the battery capacity.Note: Before storing the <strong>DaqLink</strong> units make sure you haveunplugged all the sensors and turned the units off via thekeypad.Standard ChargingWhenever a logger is reconnected to the charger it will beginthe 16-hour charge cycle, no matter what the status of thebattery. Once the charging cycle is complete the logger willrun from external power supply.Effect of Charging Battery on TemperatureSensorFor loggers measuring data with the internal temperaturesensor, it is critical to note that during the charge cycle thelogger will heat up thereby causing the internal temperaturesensor reading to rise by up to 10 ˚C above ambienttemperature. Once the charging process is complete, thelogger will cool down and the internal temperature sensorreadings will return to normal.For loggers remaining connected to AC power, to prevent thelogger from heating up again following the initial charge cycle,the logger will receive a one minute trickle charge each dayrather than stay continually charged. This is sufficient toensure the logger doesn’t self-discharge and will maintain thelogger’s full charge status.28
3.5.2. Power AdapterThe <strong>DaqLink</strong> power adapter is used to power the DBSA710and DBSA720 units. The mains adaptor (AC/DC adaptor)converts mains power (from a wall outlet) to a voltage suitableto the <strong>DaqLink</strong> hardware unit.• Output: Capacitor filtered 9 to 12 VDC, 300 mA• Female plug, center negativeNote: Only use Fourier-supplied power adapters to avoiddamaging the units with incorrect power supply.3.5.3. Data Logger Battery LifeBattery life depends on the logger sampling rate, type ofsensor, and number of measured sensors.DBSA710 and DBSA720 can last up to six months on acharged battery depending on logger configuration.3.6. USB Communication CableA mini USB communication cable is supplied as part of the<strong>DaqLink</strong> PC Suite. This cable connects the <strong>DaqLink</strong> datalogger to the <strong>DaqLink</strong> PC workstation. When connected to thePC the logger can communicate with the software forconfiguration and data download purposes, for example.The USB cable also powers the logger when connected to thePC but it does not charge the internal battery.29
Note: The USB driver is installed as part of the softwareinstallation process. Without this driver the PC won’t detectthe logger. To avoid compatibility problems do not connect thelogger to the PC before installing the USB driver.Type B plugConnect to PC USB portType A plugConnect to logger USB portFigure 13: USB communication cable3.7. <strong>DaqLink</strong> Keypad Overview3.7.1. DBSA710 and DBSA720 KeypadThe DBSA710 and DBSA720 units each have two buttons onthe keypad, which are used to navigate through the LCDmenu options, as well as turn on the units.Refer to section 3.8 to learn how to operate the data loggers.The Menu button has twofunctionalities:Navigate to the main menu. Whenpressed from within a submenu, thedisplay will take you back to the mainmenu.Selecting an option from one of themenus. When pressed on one of the30
main menu items, it will take you tothe sub menu options.The Scroll button has twofunctionalities:When the unit is off, pressing thisbutton will power the unit on.Scrolls through the menu options.3.8. Operating the DBSA710and DBSA720This section explains how to operate the DBSA710 andDBSA720 loggers and provides an overview of the menuoptions on the units’ LCD screen.3.8.1. Turning on the UnitIn order to view the logger menu options, the unit must bepowered on by pressing the Scroll button on the keypad.Ensure the logger is charged or connected to the AC adapter.Once the unit is switched on it will emit a short beep and thescreen will display a welcome message:<strong>DaqLink</strong> DBSA710Ready31
3.8.2. Display ShutdownIf the logger screen is inactive for thirty seconds it will turn off.However the logger will continue to operate in thebackground. Press the Scroll button to enable the LCDscreen again. The screen will not turn off during firmwareupgrade.3.8.3. Main Menu OptionsThere are three menu categories on the data logger:• View Data• Status• Min/Max ValuesNote: If the unit is not in Run mode only the Status menuoptions will be available.Press the Menu button to reach the main menu display.Scroll through the main menu options (View Data, Status andMin/Max Values) using the Scroll button. Once you reach themain menu option you need, press Enter to select that optionand enter the sub menus.View Data MenuView Data32
Note: View Data is the default page when the unit is running.If there is more than one sensor running, the screen will autoscroll between the sensors showing the sensor name andsenor value. These are real-time displays.The display will switch back to the View Data screen after fiveminutes if none of logger buttons have been pressed.If the sensor breached any of the predefined alarm levels,then the alarm symbol will be displayed alongside the datareading.For example:In-TMP24˚CAL-LoThe logger display alarm symbols are:• AL-HI : Alarm High• AL-Lo : Alarm Low• AL-P-H : Pre Alarm High• AL-P-L : Pre Alarm LowStatus MenuStatusThe Status menu contains the following sub menus, allreachable by using the Scroll button.The sub menus are outlined below in the order in which theyappear on the logger display.33
Name and StatusAs explained previously, the unit name (or Comment) isdisplayed on the first row and the second row indicates thelogger status.If the logger is running, then the following screen is displayed.Fourier SystemsLogger runningBatt Level (battery level)If the power adapter is not connected the battery percentagewill be displayed.If the power adapter is connected External power will bedisplayed.Batt Level: 67%Batt Level:External powerLogger VersionThis menu informs the user of the logger firmware version.This is helpful when you need to upgrade the systemfirmware, to check the current version. Or when contactingFourier technical support, with any technical issues.Logger version:2.03.00.01.98.00The firmware version is commonly referred to by the numbersin bold in the screen above. For example, the firmwareversion which is supported by this user guide is v1.98.34
S/NThis menu displays the unit’s eight digit SN.S/N 12345678Memory ModeThere are two possible device modes:• Stop when full – when the logger memory is full the loggerwill stop logging.• Cyclic mode – for continuous logging. The logger willcontinue to log once the memory is full by writing over thefirst recorded samples.The memory mode is toggled in the Setup dialog, using theCyclic Mode checkbox.When the logger memory is full, the LCD will display MemoryFull.Press Menu to pause logger (when logger is in Run mode)By pressing the Menu button, the logger will cease to log datauntil the Menu button is pressed again from the same screen.When in Paused mode, the user can still scroll through thelogger menu screens and use other features. The user mustscroll back to the Pause Logger menu in order to resume thelogger operation.Reset UnitWhen the unit is reset, upon start up it will automaticallyreconnect to the <strong>DaqLink</strong> software if a USB connection is35
established. In addition, if the logger will continue to operateaccording to its last set up instruction. For example, if thelogger was in Run mode, then after reset it will continue to runand record data.Turn Off Unit / Stop and turn offSelecting this option will shut the unit down. You can turn theunit on again by pressing the Scroll button.If the logger is in Run mode, selecting this option will first stopthe logger, and then turn it off.It is recommended to turn off the unit when it is not in use.Min/Max Values MenuEach sensor’s minimum/maximum readings (taken from thecurrent logging session) will be displayed on two rows.The first row indicates the sensor type, along with themeasurement units e.g. V, and the alarm indication if there isan active alarm on this sensor.The second row indicates the minimum and maximummeasured value and the units. H and L represent High andLow values, respectively.In-TMP ˚C26.06H 25.61L3.8.4. Additional Logger ScreensLoading FirmwareWhen updating the firmware of the data logger via thesoftware’s Firmware Update Center, the logger screen will36
display the update progress. When complete the main loggerstatus screen will be displayed.Also refer to Chapter 5: Updating <strong>DaqLink</strong> Software andFirmware.Loading firmwareProgress: 55%Note: Logger must be in Stop mode before firmware can beupdated.37
Chapter 4:Using the <strong>DaqLink</strong>SoftwareThis chapter provides detailed description ofthe <strong>DaqLink</strong> software features, allowing you tomanage your <strong>DaqLink</strong> network and perform avariety of actions on your data loggers, suchas setup, calibration, defining new sensors,managing Email and SMS notifications,firmware updates and so on.4.1. Installing <strong>DaqLink</strong>SoftwarePart of your <strong>DaqLink</strong> package includes a <strong>DaqLink</strong> softwareCD. Follow the software installation instructions providedbelow.4.1.1. System RequirementsTo work with <strong>DaqLink</strong> your system should be configuredaccording to the following specifications:Software• Windows 2000 SP3, Windows 2003, Windows XP SP2,and Windows Vista• Internet Explorer 5.01 or higher• Minimum screen resolution: 1024 x 768 (800 x 600 notsupported)38
Hardware• Pentium 800 MHz or higher• 256 MB RAM• 250 MB available disk space for the <strong>DaqLink</strong> application4.1.2. Installation ProcedurePlease read these instructions before proceeding with theinstallation process.1. Insert the <strong>DaqLink</strong> software CD into your computer’s CDdrive. The <strong>DaqLink</strong> Installation Wizard automatically startsrunning.2. The Wizard first installs Microsoft .NET Framework 2.0.The <strong>DaqLink</strong> software requires this platform in order torun. Follow the installation instructions to install the .NETFramework on your PC. This step can take up to twominutes to complete. Click Finish once installation iscomplete.3. The Silicon Laboratories USB driver installation will nowlaunch. The driver is necessary for the computer to detectthe <strong>DaqLink</strong> data logger hardware.4. Follow the on-screen instructions to continue theinstallation process. The default installation location isC:\SiLabs.39
Figure 14: Installing Silicon Labs USB driver – Step 15. The following window will pop up. Make sure to select thecheckbox to launch the driver installer, and click Finish.Figure 15: Installing Silicon Labs USB driver – Step 240
6. In the subsequent window, click Install to install thedriver.Figure 16: Installing Silicon Labs USB driver – Step 3The installation of the driver could take up to one minuteor more, depending on the system.Figure 17: Installing Silicon Labs USB driver – Step 47. Once installed click Finish to close the USB driver InstallWizard dialog.8. The main <strong>DaqLink</strong> Installation Wizard now resumes.Follow the installation instructions to install <strong>DaqLink</strong> onyour computer. Once the installation process is completedclick Finish.9. The <strong>DaqLink</strong> software and components have now beeninstalled. Double click the <strong>DaqLink</strong> shortcut on yourdesktop to launch the software.10. Connect the <strong>DaqLink</strong> data logger to a USB port on yourcomputer. It will automatically detect the logger as newhardware. After a few seconds you will see a message41
stating that the device is ready for use. You may nowbegin to configure your <strong>DaqLink</strong> units.4.1.3. Installation TroubleshootingWhen connected to the PC USB port the logger was notdetected by the software.Ensure that the USB driver was installed properly.Go to Control Panel > Add/Remove Programs (in WinXP),and check that the driver is installed:If not, you should run the Silicon Labs setup file to install theUSB driver: CP210x_VCP_Win2K_XP_S2K3.exe setup.exe toinstall the driver.If the driver is installed, ensure that there is no other devicesharing the USB com port with the <strong>DaqLink</strong> data logger.If you didn’t select the Launch CP210x VCP Driver Installercheckbox during step 2 of the driver installation wizard (seesection 4.1.2), then the driver wasn’t installed. Run the wizardagain and be sure to select the checkbox.4.2. <strong>DaqLink</strong> Software LayoutThis section provides an overview of the default <strong>DaqLink</strong>window view as well as a guide to all of the icons availablethroughout the software.The most commonly used tools and commands are displayedon two toolbars. Tools that relate to all aspects of the program42
are located in the main (upper) toolbar. Tools specific to thegraphs are located on the graph (lower) toolbar.Refer to section 4.2.5 for a description of these toolbars4.2.1. Map ViewWhen <strong>DaqLink</strong> is first launched, the default window that isopened is the Map View (see screenshot below).You can also switch to Map View at any time by clicking theMap View button in the main toolbar.This view is used to monitor the location of all of the dataloggers deployed as well as the data recorded by each sensorinput when working in Online mode.Icons are used to represent each of the <strong>DaqLink</strong> units, andusing the mouse the user can select specific actions to beperformed on the unit.Figure 18: Main window - Map ViewRefer to section 4.10 for more details on working in Map View.43
4.2.2. Viewing Sensor Data in MapViewWhen the logger is in Run mode and connected to the<strong>DaqLink</strong> software the sensor data is represented in individualwindows at the bottom of the Map View window. All sensorswhich are currently online will be displayed in this view. If alogger is currently offline then its data will not be visible.Figure 19: Main window – Sensor Data in Map ViewSensor in AlarmWhen the sensor data is in alarm, the color of the sensorwindow will change according to the alarm type. There is alegend in the lower right corner of the main window:For example:This screenshot indicates that the Internal Digital Temperaturereading is in High alarm, while the other sensors are readingat normal levels.Additional Features• The sensor windows may be dragged and rearrangedanywhere on the lower pane.44
• Double clicking the sensor window will open the DataDisplay window, where the real-time sensor data isdisplayed in graph or table view.4.2.3. History ViewClicking the History View button in the main toolbar willswitch the main window to view archived, offline data stored inthe <strong>DaqLink</strong> directory on the workstation.You must first open the archived data file by clicking OpenFile on the main toolbar. When you open the data file itwill be displayed in the History View, otherwise, the HistoryView window will be blank.Refer to section 4.8: Viewing Archived (Offline) Data on page64 for more details on opening files in History View.Figure 20: Main window – History View45
In History View, the user may view the data in graph or tableformat by clicking the relevant tabs, as well as view a numberof Statistics taken from the data set.To learn the functionality of the lower graph toolbar, refer tosection 4.2.5 below.4.2.4. Data MapThe History View window also includes the Data Map pane,on the left of the window.The Data Map displays all data sets opened in History View,saved in the current project file, and includes nodes for eachsensor in the data set.Clicking the sensor label removes the data from the graph.When the label is black, the data is not displayed on thegraph. The sensor data plot color is matched to the color ofthe sensor label in the Data Map.Each data set is preceded by a Logger icon , which canbe expanded or collapsed to display the associated sensordata.Clicking the Tree icon in the lower graph toolbar removesthe Data Map pane altogether allowing a full screen graphview.46
Data MapFigure 21: Data Map4.2.5. <strong>DaqLink</strong> Toolbar IconsThis section outlines all of the toolbar icons available in thesoftware.Main (Upper) Toolbar IconsFigure 22: Main toolbar iconsThe main toolbar is always available at the top of the <strong>DaqLink</strong>application, no matter what window view the user is in.This toolbar cannot be moved or hidden.• Open file - Opens archived logger data filestored on the PC• Map view - Switches main window to Mapview, where the <strong>DaqLink</strong> units and sensor dataare represented47
• History view - Switches main window toHistory view, where archived logger data canbe viewed and analyzed• Setup - Launches logger Setup window• Run - When logger is in Stop mode, click Runto start logging• Stop - When logger is in Run mode, click tostop logging• Download – Downloads data from logger• Alarm mute/unmute - Mutes or unmutes anaudible alarm in the system when a sensorreading has breached the user-defined alarmlevel• Email Alarm Notifications - Configurationwindow for Email alarm notifications• SMS Alarm Notifications - Configurationwindow for SMS alarm notifications• GSM Modem - Indicates if GSM modem isconnected (green icon) or disconnected (greyicon)• Temperature unit toggle - Display all data inCelsius• Temperature unit toggle - Display all data inFahrenheitTable 2: Main toolbar icon list48
Map View IconsThe following icons representing the various statuses of the<strong>DaqLink</strong> units are viewed in Map View. Using these icons theuser is able to determine the status of the logger e.g. alarm,power, and connection.Alarm status is color-coded: Green = Normal ; Red = Alarm••••••••Logger which has received its Setup but is inStop mode.Running from internal battery supply.Logger which has received its Setup but is inStop mode.Running from external power supply.Logger in Run mode and running on batterysupply.Green indicates there are no alarms.Logger in Run mode and running on externalpower supply.Green indicates there are no alarms.Logger in Run mode with an alarm alert.Running from internal battery supply.Logger in Run mode with an alarm alert.Running from external power supply.Logger is offline and is no longer detected bythe computer. Its power supply may have failedor the USB cable was disconnected.Logger is processing a command sent from thesoftware.49
•Logger is downloading data.Table 3: Main toolbar icon listGraph (Lower) Toolbar IconsThe graph toolbar is located at the bottom of the open graphview, when the user is either in Online Data Display:Or History View:The toolbar cannot be moved or hidden.•Data Map (in History View only) – Hides orshows the Data Map pane in the History Viewwindow.••••••Plot Legend (in Display Data View only) –Hides or shows the sensor labels from thebottom of the graph.Autoscale - Returns the data to its defaultscale.Zoom in – Zooms in on the graph data.Pan graph – Pans the graph along the x or yaxis.Select first cursor – Adds a cursor to thedesignated plot on the graphSelect second cursor – Adds a second cursorto the designated plot on the graph.50
•Grid – Adds a grid to the graph background•••••Add Custom View (in History View only) –adds the open, customized graph view to theData MapCopy graph – Copies the graph to yourclipboard, to be copied to a document orspreadsheet, for example.Graph properties – Opens the GraphProperties window.Export to Excel – Export the open data sets toExcel format.Print – Opens the Print dialog. Available forgraph, table and statistics views.Table 4: Lower graph toolbar icon listData Map Icons••Displayed internal Temperature sensor datasetHidden internal Temperature sensor data set••••Displayed internal Humidity sensor data setHidden internal Humidity sensor data setDisplayed external sensor data setHidden internal sensor data set51
••Displayed graph functionHidden graph function••••Table 5: Data Map iconsParent node for all logger data sets. Click toexpand or collapse all child nodes.Logger data set. Click to expand or collapsethe data set containing all measured inputs ofthe specific logger.Parent node for all custom graph views. Clickto expand or collapse all child nodes.Displayed custom graph view. When hiddenthe icon is grayed out.4.3. File Menu Items4.3.1. OpenSelect Open to access archived data files for each logger youhave configured.Shortcuts: You can also click the Open iconCtrl+O to open archived files.or press4.3.2. Open Project FileOpens project files of offline data, containing data from one ormore loggers, as opposed to standard data files containingdata from only one logger.52
4.3.3. Save ProjectThis feature lets the user save multiple data sets and customgraph views into a single Project File. Only available in HistoryView.4.3.4. Save Project AsUse this feature to save an existing Project file under adifferent name.4.3.5. ExitExits the <strong>DaqLink</strong> application.4.4. Logger Menu Items4.4.1. Display DataDisplays the logger’s data in Graph view. The graph displaysthe data in real-time. There is also the option to display thedata in Table view or to view the data statistics.4.4.2. Download DataDownloads all data in the logger memory to the <strong>DaqLink</strong>software. When logger is downloading the data, the Loggericon in Map View will appear as follows:53
4.4.3. Cancel DownloadWhen logger is downloading data you may cancel thedownload per logger by selecting this menu item.Note: This feature works only if there are no other commandsin the queue following the Download process.4.4.4. Reset AlarmWhen the logger is in a state of alarm, this option will reset thealarm state to normal on both the logger and the software.The visual and audible alarms will return to normal. If afterreset the logger is still in alarm conditions, then the visible andaudible alarms will return.4.4.5. CalibrationRefer to section 4.12.4 on page 84 for an overview of theCalibration feature.Note: A logger can’t be calibrated while it is in Run mode.The option will be grayed out. You must Stop the logger first.5.2 on page 107 for an overview of how to update the loggerfirmware.4.4.6. Cancel Firmware UpdateWhen a firmware update is in progress, select this option tocancel the update and continue using the previous firmwareversion.54
4.4.7. SetupRefer to section 4.11 on page 72 for an overview of how tosetup the logger.4.4.8. StopSends a command to the logger to stop logging data.4.4.9. RunSends a command to the logger to start logging data. Thiscommand will also clear the existing logger memory.4.4.10. Detect LoggerIf the logger is not automatically detected when connected tothe computer via USB, use this option to detect the logger.4.5. Tools Menu Items4.5.1. Define Sensor<strong>DaqLink</strong> enables the user to define custom sensors. This is auseful tool for when the data logger is communicating withmany sensor types from different vendors.Any additional sensor that you would like to connect to thelogger must comply with the following restrictions:The sensor’s output must be either voltage in the range of 0 to1 V, 0 to 50 mV, current in the range of 4 to 20 mA or Pulse inthe range of 0 to 65535 pulses.55
1. Click Tools > Define New Sensor and the Define NewSensor dialog will open.Figure 23: Define New Sensor dialog2. Click Add to enable the fields.3. Select the Base sensor from the drop-down menu(depending on whether your sensor’s output is 0 to 1V, 0 to 50 mV, 4 to 20mA, or measuring pulses).4. Enter the sensor name and sensor unit.5. Enter two calibration values (two real values and thecorresponding output values of the sensor).6. Click Close.56
To use the custom defined sensor:1. Enter the Setup dialog for the data logger you want toconfigure.2. Select the Input you wish to use and from the SensorType drop-down menu, select the custom sensor, whichnow appears in this list.3. Proceed with the setup as you would normally do.4.5.2. Lock Map ViewWhile in Map View, with Lock Map View selected the MapView icons are in a fixed position and can’t be moved. Youmust unselect this option in order to freely move the iconsanywhere on the screen. This is essential if working with acustom background image.4.5.3. Options MenuRefer to section 4.6 for more details.4.5.4. Email Alarm NotificationsThe Email Alarm Notifications dialog is where the user canconfigure all notifications to be sent via Email to a predefinedcontact list. Refer to section 4.12 for details.4.5.5. SMS Alarm NotificationsThe SMS Alarm Notifications dialog is where the user canconfigure all notifications to be sent via SMS to a predefinedcontact list. Refer to section 4.12 for details.57
4.6. Tools > Options MenuItemsThe Options dialog is divided into three main tabs:• Preferences• Email Settings• SMS Settings4.6.1. Preferences TabFigure 24: Options > Preferences tab58
The Preferences tab includes the following options:Minimize application to system trayWhen this checkbox is selected, the <strong>DaqLink</strong> icon willappear in the computer’s system tray in the lower right of thescreen when the application is minimized. Simply double-clickthe icon to maximize the application to full screen.Run application on Windows startupSelect this checkbox to have the <strong>DaqLink</strong> application launchtogether with Windows start-up.Map View backgroundUse this option to toggle between Stretch and Center viewsfor the background image used in Map View.Set decimal places for…For each <strong>DaqLink</strong> sensor, internal or external, you may selectbetween 0 and 6 decimal places to be used when displayingthe data in the software.Date formatChoose between four date formats to be used throughout thesoftware when displaying data e.g. in the Graph display.Ignore regional settings when exporting to CSVSelecting this option will ensure that data will be correctedexported to a CSV file and will not use any custom regionalsettings in the Windows OS which might adversely affect thelayout of the data in the CSV file.59
Path for application data filesThe default path for saving all data recorded by the dataloggers is:C:\Program Files\Fourier Systems\<strong>DaqLink</strong>\<strong>DaqLink</strong> data files\Click Browse to change the path e.g. to a network path.Save text data filesSelect this checkbox if you would like <strong>DaqLink</strong> to also savethe logger data to a text file. The default path is: C:\ProgramFiles\Fourier Systems\<strong>DaqLink</strong>\<strong>DaqLink</strong> data text files\ andclicking Browse will let you change this path.Enable automatic data download when <strong>DaqLink</strong> islaunchedSelect this checkbox if you want to have automatic downloadof data when the <strong>DaqLink</strong> software is launched. If a <strong>DaqLink</strong>logger is connected to the PC during software launch thendata will be automatically downloaded.4.6.2. Email Settings Tab<strong>DaqLink</strong>’s alarm notification feature enables sending of Emailsto notify the user of any alarm in the system. This feature willonly work when the <strong>DaqLink</strong> is working in Online mode.First select the Send Email notifications check box. Fill inthe fields accordingly so that <strong>DaqLink</strong> will be able to sendEmails to predefined Email contacts when your loggers havebreached certain alarm levels.Make sure to enter the field correctly e.g. with no extra spacesor typos.60
Refer to section 4.11.2 for setting Alarm levels on the loggerand to section 4.12 for managing the Email alarmnotifications.Note: <strong>DaqLink</strong> supports SMTP and MIME encoding, andPOP3 mail protocols.Figure 25: Options > Email Settings tab4.6.3. SMS Settings Tab<strong>DaqLink</strong>’s alarm notification feature enables sending of SMS’sto notify the user of any alarm in the system. This feature willonly work when the <strong>DaqLink</strong> is working in Online mode.First select the Send SMS notifications check box. Using theSMS feature requires connection of a GSM modem and SIMcard to the <strong>DaqLink</strong> PC, or even just a cellular phone with anactive SIM card.61
You must select the COM port which the GSM modem/cellularphone is connected to in order for the software to detect it.Note: When using a cellular phone as a modem, ensure thatthe PC software suite is disabled before connecting the phoneto the PC com port. Otherwise the com port will not beavailable for the <strong>DaqLink</strong> software.Once the configuration is complete, <strong>DaqLink</strong> will be able tosend SMS’s to predefined SMS contacts when your loggerhave breached certain alarm levels.Refer to section 4.11.2 for setting Alarm levels on the loggerand to section 4.12 for managing the SMS alarm notifications.Figure 26: Options > SMS Settings tabNote: Once the GSM modem is online you will see the greenGSM iconappear in the <strong>DaqLink</strong> upper toolbar.62
4.6.4. Analysis Menu ItemsThe Analysis menu items are enabled when viewing offlinedata in History View.The Analysis options available are:• Functions Parameters• Dew Point• FO Pasteurization• Histogram• Export to Excel• Export to CSVExport to ExcelYou may export offline data to Excel by selecting this menuitem or by clicking the Export to Excel icon in the lowergraph toolbar in History View. The data is opened in an Excelworksheet and includes pertinent information such as loggername, SN, sensor names, alarm levels as well as the actualdata readings.Refer to section 4.15 for more information.Export to CSVYou may export offline data to CSV file format by selectingthis menu item. Upon selecting this option, you will beprompted to save the file either in the default <strong>DaqLink</strong>directory or in directory of your choosing. The data is openedin CSV file format and includes pertinent information such aslogger name, SN, sensor names, alarm levels as well as theactual data readings.Refer to section 4.15 for more information.63
4.7. Saving DataAs soon as a logger starts to record data the software createsa data file to which it writes the logger data.Logger data files are stored in the following default location:C:\Program Files\Fourier Systems\<strong>DaqLink</strong>\<strong>DaqLink</strong> data filesA folder is created for each data logger and is namedaccording to the logger Serial Number. In this folder is storedthe data files. A file is created for each day that the logger isrecording data. The file name format is the date followed bythe file extension e.g. 2007-12-30.dat.The data is saved automatically by the software. There is noneed for the user to save the data manually. The data issaved to the data file as follows:• Every 15 minutes• When the software is closed• When the user opens an archived data file, the file isupdated with all data not saved to that pointYou can also save the data in a text file format. Refer tosection 4.6.1 for more details.4.8. Viewing Archived (Offline)DataThe user can view the logger data online or can choose toopen archived data. Archived data is all data that was loggedby a specific logger and recorded by the software into the<strong>DaqLink</strong> directory on the PC.64
Follow the instructions below to open archived data.1. Click the Open icon to launch the Open Data Filesdialog.2. Select the logger from the list of loggers in the dialog. Youcan sort according to logger S/N or Comment.3. Using the calendar define the date and time period forwhich you wish to view your data and click OK. Days forwhich data exists appear in bold.Figure 27: Open Data Files dialog4. In the Sync Data dialog, you can select the sampling rateat which you wish to display the data. The default optionis the original rate. Click OK.65
Figure 28: Sync Data dialogThe data is opened in History View. Refer to section 4.2.1 foran explanation of the History View.You may display data sets from more than one logger anddisplay them all in History View, using the Data Map tonavigate through the data. Refer to section 4.2.4 for moredetails regarding the Data Map.4.9. Viewing Online DataWhen the logger is connected to the PC and detected by the<strong>DaqLink</strong> software you can view its data online in real-time, asit is being recorded and transmitted to the PC.• While the logger is running double click the Logger iconin the Map View.• While the logger is running open the logger context menuand select Display Data.66
Figure 29: Online data windowThe data displayed in this window is the data that wastransmitted by the logger in the current software session. Datatransmitted during a previous session of the software beingopen will not be displayed. For example, when you setup thelogger it creates a new online session. This data can beviewed by opening archived data. Refer to section 4.8.You may view the data in a graph or table by clicking therelevant tabs in the online data window. While in either orthese views, the data is constantly being updated in real-timein the respective view according to the sampling rate of thelogger.67
4.9.1. Showing/Hiding the Data SetsIn the online graph display, where you have data from onlyone logger displayed, you can show or hide the individualsensor data by using the sensor labels at the bottom of thegraph.In the screenshot above you can see two labels, InternalDigital Temperature and Int RH. At present, each label isactive meaning the sensor data corresponding to the label isshown on the graph.By clicking any of the sensor labels, you can hide the datafrom the graph. The label will then be grayed out. See thescreenshot below:68
Note: You can hide all of the sensor labels (not plots) from thegraph by clicking the Plot Legend icon .4.10. Working in Map ViewThe Map View is the main view from which you monitor yourloggers.Refer to section 4.2.1 for a quick overview of the Map Viewand section 4.2.5 for a list of all the Map View icons.4.10.1. Loading Map View WallpaperYou can load an image file representing a map of your facilityin which the loggers are deployed. You can then move theunit icons into their actual positions on the map.• Double-click on the Map View background to gostraight into the Open dialog and locate the image file.• Right-click on the Map View background to open theWallpaper dialog and have the option to either Load orReset the wallpaper.Note: When deploying the system for the first time it is highlyrecommended to use a map of the facility to make thedeployment work efficiently.4.10.2. Moving Icons around theScreenGo to Tools > Lock Map View and ensure this menu item isnot selected in order to freely move the unit icons around thescreen. When you have finished placing the icons into69
position you may then lock the Map View so as not tomistakenly place an icon out of position.4.10.3. Logger Icon Context MenuRight clicking the Logger icon will give the following options,which also appear in the Logger main menu and are detailedin section ?:• Display Data• Download Data• Cancel Download• Reset Alarm• Calibration• Update Firmware• Cancel Firmware Update• Setup• Stop• RunThe Remove option only appears in the Logger icon contextmenu, and only when the logger is offline. Selecting Removewill simply remove the logger icon from the Map View.4.10.4. Viewing Logger StatusWhen you scroll the mouse cursor over the Logger icon atooltip will pop up displaying data relevant to the Logger statusat the time.70
Logger TooltipThe tooltip will always display the following data, even ifoffline:• Model type• Serial Number• Logger Name/CommentWhen the logger is online and running the following tooltip isdisplayed:In online mode, the logger also displays:• Power status (% Battery left or Connected to AC)• Version number: Firmware version of the logger• Last sample time: If logger is running, time stamp of lastrecorded sample.• Real-time Sensor values: All sensor values are displayed,including sensor name and alarm status.Command Queue ProgressThe tooltip is updated with specific commands beingperformed by the logger. For example, if the logger isdownloading data to the software you can see the progress inthe tooltip. In addition, the Logger icon has a blue progress71
indicator so you can monitor the progress without using thetooltip.Common commands include Download, Setup, Stop, andRun.4.11. Configuring the Logger<strong>DaqLink</strong> software allows you to configure each logger whenconnected to the workstation.Also refer to section 2.6 on how to configure the logger.To configure the logger once it’s detected by the <strong>DaqLink</strong>software, right-click the Logger icon in the Map View andselect Setup or go to Logger > Setup from the main menu.You have two tabs, Device Setup tab and Alarm Setup.The main logger configuration is performed on the DeviceSetup tab. Any alarm levels you wish to configure isperformed on the Alarm Setup tab.4.11.1. Device Setup TabCommentThis is the name of the logger. It is advisable to name thelogger according to the location in the facility.Note: The Comment field in the software and on the loggerdisplay supports all standard alphanumeric characters exceptfor the following: ', ", ~, &, \72
Sampling RateSampling rate is one sample per second to one sample per 18hours. However, there are programming limitations you mustbe aware of when configuring the loggers. The sampling ratewill vary depending on the number and type of sensors yousetup. Refer to section 3.3.5 on page 22.Memory StateFrom the drop-down menu you have the following options:• Online Mode: For working with logger connected to PC.Data will be transmitted in real-time i.e. at the same timeas the sampling rate.• Optimized Memory Mode: For working with the loggeras a standalone device, not connected to the PC. In thismode, the memory is more efficiently managed as thedata does not need to be transmitted together with thesampling rate. Use the Transmissions intervalparameter in the Setup window to see the rate at whichthe data will be displayed on the logger or in the software.Note: If used when connected to the PC, the data will notbe transmitted in real-time.Cyclic ModeIf this checkbox is not selected, the logger will stop recordingdata when the memory capacity is filled.Enabling Cyclic mode will result in the oldest samples in thememory being overwritten by new samples once the memoryis full. This allows continuous data logging.73
Averaging PointsYou can choose have online averaging of up to 10 pointsaround the real value in order to smooth the data readings, ifthey are a little noisy. The recommended averaging is 4samples.Note: If configuring Alarm duration with averaging pointsselected, the alarm will be counted from the time of the lastsampling point used to calculate the average.Temperature UnitsToggle between °C and °F. This applies to the readingsdisplayed on the logger LCD as well as in the software.Anti Tamper ModeTo prevent tampering with the <strong>DaqLink</strong> logger, selecting thisoption will disable the following features on the logger menu:• Pause• Reset• Stop and turn off unitActive SensorsDepending on the logger model, you can activate up to twointernal sensors and four external sensors. Simply select theinputs you want to use and then select the sensor types fromthe adjacent drop-down menu. You don’t have to select theexternal sensor input in any order. You may select only Input4 if you desire.Note: On the DBSA720 you cannot run the humidity sensorwithout running the temperature sensor in parallel.74
This is because when using the DBSA720 data logger andselecting the internal humidity sensor in the Device Setupdialog, the internal digital temperature sensor willautomatically be selected as well. This sensor provides thetemperature compensation necessary for the humidity sensorto reach the 3% accuracy as stated in the sensorspecifications. It is not used for recording temperature. Theinternal digital sensor is used to record temperature on theDBSA720.Custom Sensor NamesYou can also give the sensor a custom name, which willappear in the software when viewing the data. This isconvenient when using several of the same type of sensorsand you wish to differentiate between them in terms of theirenvironment or material it is measuring.Recording TimeThis field displays the length of time the logger memory will beable to record for depending upon the number of sensorsused and sampling rate.Setup and RunClicking Setup and Run will send the setup to the logger andimmediately start logging data.Setup OnlyClicking Setup Only will send the setup to the logger but it willnot actually start logging data. You will need to select Runfrom the Logger context menu or go back into the Setupdialog.75
CloseClicking Close will close the Setup dialog without saving anyof your configurations.Note: Running the logger clears the logger memory. Allpreviously recorded data will be erased when you begin a newlogging session.4.11.2. Alarm Setup TabA major feature of the <strong>DaqLink</strong> system is the ability toconfigure alarm levels into the loggers so any breach of theselevels as recorded on the data logger is monitored by thesoftware, and the user is notified via Email/SMS/audible andvisual indicators.The Alarm Setup tab lets you configure each sensor for thefollowing alarms:• Low• Pre-Low• Pre-High• High• Contact Open / Contact Close (when the Contact sensoris selected)Using the Pre Alarms gives the user ample warning of apossible breach of real alarm levels, so necessary measurescan be taken to prevent such a breach.Simply select the check box for the type of alarm you wish tobe notified. You can select all alarms too. Enter the alarmvalue in the text box.76
Figure 30: Alarm Setup tabAlarm Delay and Pre-alarm DelayThe time until the alarm (or pre-alarm) is activated. You maynot want to have the alarm sound immediately after the alarmlevel is breached as you are only interested in a conditionwhere the alarm level lasted a certain amount of time.For example, if monitoring change of temperature in a freezer,you would only be interested in a High alarm which lastedmore than one minute as anything else could just be causedby the freezer door opening for a few seconds, as opposed toa power failure leading to rise in temperature.77
Alarm DurationThe duration of the alarm that is set off by one or moresensors breaching the alarm level.Note: Ensure Averaging is set to zero when enabling theAlarm Duration feature.Sound Alarm during Pre-alarmYou also have the option to sound the alarm in the softwareduring a pre-alarm scenario, not just for a standard alarm.Once you have configured your alarms, you may return to theDevice Setup tab or click one of the Setup buttons at thebottom of the tab.4.12. Alarm Notifications SetupOnce you have completed the logger alarm setup in section4.11.2 above, you can now configure <strong>DaqLink</strong> to send alarmnotifications via Email or SMS.From the Tools menu select one of the following options,depending on the type of notifications required:• Email Alarm Notification• SMS Alarm NotificationOr click the Email or SMS icons located in the uppertoolbar in order to launch the notification dialog.Note: To enable sending of Email or SMS first define theEmail and SMS settings in the Tools > Options dialog.Connect a GSM modem to the PC if sending SMS’s. Refer tosection 4.6 on page 58 for more details.78
The Alarm Notifications dialog also lets you manage yourcontact list of alarm notification recipients.Figure 31: Alarm Notifications Setup dialogAs the Email and SMS Alarm Notifications must be definedseparately, they each have separate dialogs. However theinterface is identical and the contacts are stored in the samedatabase.The Email/SMS Notifications dialog is divided into thefollowing tabs:• Notifications Setup• Contacts tab• Groups tab79
4.12.1. Contacts TabThe first step is to create the contacts who shall be receivingthe notifications. The ability to manage contacts is possiblefrom both the Email and SMS Notifications dialogs.1. Click the Contacts tab and then click Add Contact.Figure 32: Adding a contact2. In this dialog you must first enter the contact name in theName field. That is the only mandatory field but if youdon’t enter at least the phone number or Email then theywon’t receive any alarm notifications.The other fields in the dialog are as follows:• Title: Corporate position• Phone number: The number the <strong>DaqLink</strong> softwarewill use to send the SMS notification.80
Note: The phone number field supports the followingcharacters: 0-9, # , *, -, ( ), +• Email: The address the <strong>DaqLink</strong> software will use tosend the Email notification.• Workday Start and End: You can define the hours inwhich the contact will be eligible to receive thenotifications i.e. so they don’t receive SMS or Emailwhile in the office, or vice versa.• Vacation: You can define when the contact is onvacation so they won’t receive any notifications overthis period.• Number of SMS resends: The number of times<strong>DaqLink</strong> will send follow-up SMS’s with the alarmnotification. The maximum is nine resends per alarm.The gap between each resend is five minutes.Note: In order to stop receiving SMS resends, you cansimply send an SMS with ‘OK’ in the message body tothe GSM SIM card’s phone number.3. When the contact details have been entered, click OK.4. The contact will be added to the Contacts tab. You maychoose to add another contact, edit an existing contact orremove a contact from the list.4.12.2. Groups Tab1. Click the Groups tab and then click Add Group. TheGroup Details dialog will open.81
Figure 33: Adding a group2. Enter a Group name and add your existing contacts to thegroup by selecting the checkbox next to the Contactname.3. Click OK to create the Group. In the Groups tab you maychoose to add a group, edit an existing group or remove agroup from the list.4.12.3. Notifications Setup Tab1. Once the contacts have been created you may startdefining which contacts should receive the alarmnotifications.2. The pane on the left-hand side of the Notifications Setuptab displays all loggers, which have been configured inyour facility. You must define the alarm notifications foreach unit in turn. Select the first unit you wish to define.3. The Email or SMS tab is now active for the unit selectedin step 1 above. In this tab, select the type of alarm for82
which the notification should be sent in the event that thepredefined alarm level is breached.4. Only the sensors which were configured in the loggerSetup, with alarms levels, are enabled in this tab.5. Select the checkboxes according to the type of sensoralarm for which notifications should be sent.You may also select a Normalized alarm. A notificationwill be sent when the logger returns to normal levelshaving previously been in alarm state.6. Click the Contact button adjacent to each of the sensorswhich have defined alarms. In the Select Contact dialog,select the contact and/or group that will receive thenotification.7. You can also click Check All to select all the sensoralarms for notification.Note: In Optimized Memory Mode, when the loggertransmission rate is slower than the sampling rate, analarm notification is still sent even if the loggertransmission time hasn’t passed. For example, if thesampling rate is every 5 minutes, and the transmissionrate is every 10 minutes, if a logger reaches a high alarmafter 7 minutes a notification will be sent. The systemwon’t wait until the scheduled transmission time.83
4.12.4. Email and SMS NotificationFormatsEmail Notification FormatWhen the Email notification is sent the recipient receives theEmail in the following format:Email Header:<strong>DaqLink</strong> Alarm Internal Temperature (Last recorded 25.47C)Low AlarmEmail Body:<strong>DaqLink</strong> AlarmComment: Factory 1/FS/N: 80893208-07-09 13:53:41Internal Temperature Low AlarmLast recorded 25.47 CThe Email header contains the sensor type, last recordedsample, and alarm type.In addition the Email body contains the logger comment, serialnumber, time stamp of last sample and value of last sample.SMS Notification FormatWhen the SMS notification is sent the recipient receives theSMS in the following format. (The logger comment isdisplayed in the first row).Factory 1/FSensor: Internal Digital Temperature – HighAlarm last recorded 29.59 C84
4.13. CalibrationThe <strong>DaqLink</strong> data loggers are shipped fully calibrated with acalibration certificate. However, <strong>DaqLink</strong> does provide asimple and efficient process for users wishing to calibrate the<strong>DaqLink</strong> data loggers themselves. The process itself can beperformed when the logger is connected to the PC via USB. Acalibrator or other type of calibration instrument is necessary.The Calibration options are accessible via the Logger contextmenu in the Map View (right-clicking the Logger icon).Before performing logger calibration, the logger must be inStop mode. In addition, all of the calibration options areaccessible with a password making it difficult for nonauthorizedusers of the system to tamper with the loggers’calibration settings.Note: The default password is 1234. The password can bechanged in the password dialog box.The Calibration option menu options are:• Calibration: Opens the main Calibration dialog• Save Calibration: Saves the logger’s current calibrationsettings• Load Calibration: Loads a logger’s previously savedcalibration settings.• Reset Calibration: Resets the logger’s calibrationsettings so that the raw hardware data is obtained,without any software calibration applied to these values.• Restore Factory Calibration Default: Restores thelogger’s calibration settings to the factory calibration i.e.85
the calibration settings it received prior to shipment fromFourier.4.13.1. Introduction to <strong>DaqLink</strong>CalibrationAlthough the <strong>DaqLink</strong> data loggers come fully calibrated, thesoftware enables you to calibrate any of the <strong>DaqLink</strong> sensors,on any input. The calibration parameters are sent to the datalogger and stored in its memory.<strong>DaqLink</strong> employs two different calibration methods: Twopointcalibration and Offset calibration.Each sensor can be calibrated using the Two-point calibrationmethod, and then tweaked using offset calibration, except forthe Thermocouples. These sensors require offset calibrationonly.Sensor Type CalibrationMethodTwo-pointCurrent4 – 20 mAcalibrationTwo-pointHumidity (Internal) DigitalcalibrationTemperature(Internal)Temperature(Internal)TemperatureDigitalPT-100PT-100 2-wireTwo-pointcalibrationTwo-pointcalibration andoffsetTwo-pointcalibration andoffsetTemperature Thermocouple J Offset calibration86
Temperature Thermocouple K Offset calibrationTemperature Thermocouple T Offset calibrationVoltageVoltage0 to 1 V0 to 50 mVTwo-pointcalibrationTwo-pointcalibrationCalibration TipsPrior to any two-point calibration it is recommended to restorefactory calibration defaults.Prior to calibrating any of the thermocouple sensor types,calibrate the Voltage 50 mV sensor as this will set the gain(slope) of all thermocouple sensor types.After calibrating 50 mV, TC-J, TC-K or TC-T sensor types forall inputs you can refine the offset calibration for each inputindividually.You may calibrate all thermocouple sensor types at once, orindividually.Prior to calibrating the PT-100 input, you must first performReset Calibration in the Calibration dialog.Two-point CalibrationThe two-point calibration sets the gain (slope) and offset(intercept) of the sensor's conversion function.Use the two-point calibration to calibrate all <strong>DaqLink</strong> sensorsexcept for the Thermocouples. In some cases you may needto refine your calibration using the fine offset tuning tool.87
Offset CalibrationTo calibrate the Thermocouple temperature sensors: TC-J,TC-K and TC-T, first calibrate the 50 mV sensor type. That willset the slope for all Thermocouple temperature sensors. Thenproceed to adjust the offset using the Offset calibrationtechnique.4.13.2. Calibrating the Data LoggerFigure 34: Calibration dialog1. From the Map View, open the Logger context menu andselect Stop.2. Select Calibration > Calibrate and enter the password inthe Password dialog.88
3. Select the sensor you wish to calibrate from the Sensordrop-down menu.4. If calibrating an external sensor, select the inputs tocalibrate. Select All or an individual input, 1 to 4.5. Click Setup to send the sensor setup to the logger.Note: The calibration process does not delete the logger’ssetup prior to calibration. Once Calibration is complete theoriginal logger setup will be restored.6. If you selected All inputs, then by default the logger willbe setup to log data on Input 1 during the calibrationprocess. Otherwise, if you selected a specific input, it willsetup the logger to calibrate on that input.Logger Data PaneThe Logger Data pane displays real-time readings on thelogger, at a default sampling rate of one per second. You canalso view the logger’s general status. Use the Logger Datapane to verify your logger is properly calibrated.The Calibration dialog will enable either Two-point or Offsetcalibration, or both, depending on the sensor selected.Note: The calibrated sensor parameters will be saved both inthe <strong>DaqLink</strong> logger and in the software memory, so there is noneed to calibrate the logger every time you run the software.4.13.3. Performing a Two-pointCalibrationTo perform a two-point calibration, you must have tworeference points to input against the real logger sensorvalues.89
Figure 35: Two-point calibration window1. In the Point #1 field, enter the first Reference Value andthe corresponding Logger Value.2. In the Point #2 field, enter the second Reference Valueand the corresponding Logger Value.Note: If you are using a calibrator and the logger is currentlydisplaying the real value to be calibrated, press the Copybutton to copy the real value to the Logger Value text box.3. Press Send Calibration to send these values to thelogger memory.4. Compare the real value in the Logger Data pane to thereference value. If the values are within an acceptablemargin of error you may close the Calibration window, ormove on to the next sensor or input.5. If the values are still not accurate enough, you canperform Offset calibration to tweak with values further.Note: Fourier strongly recommends calibrating using thedefault Reference values that appear in the two Referencevalue text boxes for each sensor.90
4.13.4. Performing an OffsetCalibrationIf, after the Two-point calibration procedure, the logger stillexhibits some offset value use the Offset calibration tool tocorrect it.The offset value is the difference between the value displayedby the <strong>DaqLink</strong> logger and the reference value. For example ifthe calibrator is set to 0 °C and the logger reads 1 °C theoffset value is +1, but if the logger reads −1 °C then the offsetvalue is −1.To perform an Offset calibration, simply select the Offsetcalibration radio button to enable the Offset text box. ForThermocouples you will only have the option to perform anOffset calibration.Enter the offset value in the text box and click SendCalibration. Continue to adjust the offset accordingly untilsatisfied with the readings.4.13.5. Setting the Offset to a SpecificInputAfter setting the offset to all inputs simultaneously, you canset the offset of each input separately for even betteraccuracy.To set the offset of a specific input:1. Measure two known reference values making sure to usethe input you need to calibrate.2. Enter the offset value as described in section 4.13.4above, making sure to select the correct input numberinstead of All.91
3. You can repeat the procedure for every input.4.13.6. Calibrating the InternalTemperature Sensor on theDBSA710The DBSA710’s internal temperature sensor is a PT-100sensor. Calibration of this sensor is performed by calibratingthe external PT-100 input i.e. two-point calibration followed byoffset calibration.1. In the Calibration dialog, select PT-100 in the Sensordrop-down menu and select All inputs.2. Press Setup to proceed.3. Connect a calibrator or an actual PT-100 sensor to Input-1. Calibrate the input using the reference values.Once this calibration procedure is complete both the logger’sinternal temperature sensor (PT-100) and external PT-100inputs will be calibrated.4.13.7. Calibrating the External PT-100Sensor InputPT-100 calibration is a standard 2-point calibration followed byoffset calibration. Once the PT-100 sensor has been selectedin the Sensor drop-down menu, click the Reset Calibrationbutton. Then proceed with the 2-point calibration procedure.Before each calibration this step must be performed otherwisethe calibration will not be accurate.92
4.13.8. Saving Calibration SettingsAt any time you may manually save the logger’s calibrationsettings locally to your PC.1. Open the logger context menu, select Calibration > SaveCalibration and enter the password to access thisfeature.2. The Save As dialog will open. Name the calibration file(with extension .dcf) and save it either in the defaultCalibration folder in the <strong>DaqLink</strong> directory or in a folder ofyour choice.4.13.9. Loading Calibration SettingsYou can load a previously saved <strong>DaqLink</strong> .dcf calibration fileat any time to restore a logger’s specific calibration settings.1. Open the logger context menu, select Calibration > LoadCalibration and enter the password to access thisfeature.2. In the Open dialog, browse to the calibration file you needand click Open. The logger will be updated with the newcalibration settings.4.14. Analyzing the DataWhen in offline (History View) or online data displays, youhave a number of features for analyzing the on-screen data.The features for analyzing data while in the graph display arepractically the same when in offline or online mode.93
4.14.1. Using the Graph FeaturesThe following section explains how to use the numerousgraph analysis features, including an overview of the graphtoolbar options.Please first refer to section 4.2.5: <strong>DaqLink</strong> Toolbar Icons for afull overview of the graph toolbar.AutoscalingClick Autoscale on the graph toolbar to view the full datadisplay, thereby restoring the axis range to its default settings.ZoomingTo zoom in to a specific area of the graph:1. Click Zoom in on the graph toolbar.2. Drag the cursor diagonally to select the area you want tomagnify. Release the mouse button to zoom in to theselected area.3. Click Zoom in a second time to disable the zoomtool.4. Click Autoscale to restore the default display.PanningUse the Pan tool to pan along the x or y axis or afterzooming in, to see any part of the graph that is outside thezoomed area.94
1. Click Pan on the graph toolbar, then click anywhereon the graph and drag the mouse to view another area.2. Click the Pan icon a second time to disable the Pan tool.The CursorYou can display up to two cursors on the graphsimultaneously.Use the first cursor to display individual data recording values.Use two cursors to display the difference between twocoordinate values, to display the frequency of periodic data orto select a range of data points.Figure 36: Example of using two cursorsWhen using two cursors, the Statistics feature will calculatestatistics according to the data set between the two cursors.To display the first cursor:Click 1 st Cursor on the graph toolbar. You can drag thecursor with the mouse onto any other point on the plot, or onto95
a different plot. For finer cursor movements use the forwardand backward keys on the keyboard.The coordinate values of the selected point will appear in theinformation bar at the bottom of the graph window.To display the second cursor:Click 2 nd Cursor and drag the cursor with the mouse ontoany other point on the plot. The information bar will nowdisplay the difference between the two coordinate values.To remove the cursors:Click the cursor icons a second time.GridClick the Grid icon to add a grid to the background of thegraph view. To remove the grid, click the icon again.Figure 37: Graph with grid in background96
Add Custom ViewWhenever the graph in History View is modified, either byusing the Zoom tool, changing the scale, panning the graph,etc. you have the option to add this customer graph view tothe Data Map, under the Custom Views node. This will enableyou to save projects which include the custom graph view forfuture reference.Click the Add Custom View iconto perform this function.Copying the GraphClick the Copy Graph icon to copy the graph to theclipboard, and paste it into another application, such as aword processing or spreadsheet application.Displaying Alarm LevelsOpen the Alarm drop-down menu and select the relevantsensor to display its alarm levels.The Stretch/Compress Axis ToolMove the cursor onto one of the graph axes. The cursor iconchanges to the double arrow symbol (↔), indicating that youcan stretch or compress the axis scale. Drag the cursor to thedesired location. Repeat the procedure for the other axis ifnecessary.97
To select a data set to display on the Y-axis, click on the dataset’s name in the Y-axis list. To display more than one curve,click on the data sets you want.Formatting the GraphYou can change the plot line’s color and width. The color ofthe Y-axis matches the corresponding plot’s color and willautomatically change with any change made to the color ofthe corresponding plot.1. Click Graph properties on the graph toolbar to openthe Graph properties dialog box.2. Select the Style tab, and unselect the Use system lineproperties checkbox.3. Select the axis you want to format in the Axis drop-downmenu.4. Select the color and line width.5. Click OK.6. To restore the default formatting, select the Use systemline properties checkbox again.Manual Scaling1. Click Graph properties on the graph toolbar to openthe Graph properties dialog.2. Select the Axis Scaling tab and with the Group plots byunits checkbox unselected, select the axis to manuallyscale from the drop-down menu e.g. Date & Time axis.3. Uncheck the Autoscale check box and enter the customvalues in the text box i.e. a time range, in the case of theTime & Date axis, or a set of values.4. Click OK.98
5. To restore auto scaling select the Autoscale checkbox.Manual Scaling - Grouping Plots by UnitYou may choose to group all of the sensors measuring thesame unit, to the same scale. For example, if you haveseveral temperature sensors in your data set, all measuringCelsius, you can apply a common scale when displaying thedata from these sensors.1. Click Graph properties on the graph toolbar to openthe Graph properties dialog.2. Select the Axis Scaling tab and select the Group plotsby units checkbox.3. In the Axis drop-down menu select the unit by which youwish to group the plots.4. Uncheck the Autoscale check box and enter the customvalues in the text box.5. Click OK.6. To restore auto scaling select the Autoscale checkbox.Figure 38: Grouping plots by units99
4.14.2. Statistical Analysis<strong>DaqLink</strong> also provides some basis statistics regarding theopen data sets. While in History View or online Data Displayview, click the Statistics tab.For each of the sensors in the data set, you will have thefollowing statistics displayed:• Minimum / Maximum values• Average value• Number of samplesYou will also see the Logger name and SN, as well as thestart and end time of the statistics data range.While in Online mode these statistics are updated in real-time.If you zoom onto a section of the graph, the statistics aredynamic and will therefore display statistics of the zoomedgraph, not of the whole graph.If using the cursors, the statistics will be calculated accordingto the data set between the two cursors.Figure 39: Statistics View4.15. Exporting Data to Excel orCSV Formats<strong>DaqLink</strong> supports exporting data to Excel or CSV file formats(CSV stands for comma separated values).100
To export to Excel, click Export to Excel in the online oroffline lower graph toolbar, or go to Analysis > Export toExcel (while viewing data in History View). The data currentlydisplayed on the graph is exported. Data from more than onedata logger may be exported simultaneously.<strong>DaqLink</strong> will then open a new Excel workbook displaying thedata as well as other pertinent information such as loggercomment, serial number and the alarm level setup. Data thatexceeds any of the alarm levels will be indicated.Figure 40: Example of data exported to ExcelOnly offline data opened in History View can be exported toCSV and is available under the Analysis menu.4.16. Printing the DataYou are able to print data by clicking the Print icon fromthe lower toolbar in Graph, Table or Statistics tabs of theoffline or online data displays. Clicking the Print icon will openthe Print Setup dialog where you will need to select theprinter to print to.101
When printing a table, you can select the specific data rangeyou wish to print. You are able to adjust the date and time inorder to narrow the data range.Figure 41: Printing a table4.17. System PasswordThroughout the software you will be required to enter apassword to perform certain functions such as calibration orfirmware update.Note: The default password is 1234.To change the password:1. In the Password dialog box, click Change Password toopen the Change Password dialog box.2. Enter the current password in the Current Password textbox.3. Enter the new password in the New Password text box.4. Enter the new password a second time in the ConfirmNew Password text box to confirm your new password.5. Click OK.102
Note: The password must include at least 4 characters and iscase sensitive.103
Chapter 5:Updating <strong>DaqLink</strong>Software and Firmware<strong>DaqLink</strong> supports automatic software and firmware updatewhenever <strong>DaqLink</strong> is launched, as long as the PC isconnected to the Internet. The update process is managed byFourier Systems’ Uptodata client. This client checks forupdated software and firmware files as well as documentationlocated on the Fourier Systems server, and if any have beendetected they are downloaded and updated on the user’s PC.The user can also have <strong>DaqLink</strong> automatically update thelogger’s firmware or can choose to do so manually.In addition to automatic firmware update, the user can alsomanually update the firmware via the software menu or fromthe logger icon in Map View. Refer to the relevant sections inthis chapter for more details.5.1. Using the Uptodata ClientUse the Uptodata client to perform automatic checks forupdated <strong>DaqLink</strong> software and firmware versions, includingupdated versions of the <strong>DaqLink</strong> user guide. Oncedownloaded, <strong>DaqLink</strong> software and firmware is automaticallyupdated. However, you also have the option to manuallyupdate firmware rather than automatically.To use the Uptodata client follow the instructions below.1. Ensure the PC is connected to the Internet and launch<strong>DaqLink</strong>.104
2. Launch the Uptodata update client from the <strong>DaqLink</strong>main menu: Help > Check for Updates.3. You will be prompted to proceed to check for newupdates. Click Next. The client will then check for updateson the server, including updates to the Uptodata clientitself.Figure 42: Uptodata dialog4. Once the check is complete, any new updates will bedisplayed in the Uptodata dialog. Select the checkboxnext to the file you wish to update and click Next.105
5. The files will be downloaded to your default applicationdirectory. Click Finish to close the dialog once thedownload is complete.6. Click the Options button in the main Uptodatadialog for further configuration options such as automaticfirmware update on startup, or defining how often to checkfor updates.Figure 43: Uptodata configuration dialog106
Note: If the update was canceled for any reason and was notcompleted, none of the previous installation files will beaffected.5.2. Updating <strong>DaqLink</strong>FirmwareThere are several ways to update firmware for your <strong>DaqLink</strong>hardware units.• Automatically, using the Uptodata client. Refer to section5.1 above.• Manually, using the context menu on the logger icon inthe Map View or from the Logger main menu.5.2.1. Downloading the Firmware File1. There are two ways to obtain the <strong>DaqLink</strong> firmware file.a. Using the Uptodata client to download from theFourier Systems server. Refer to section 5.1 above.b. Downloading the latest firmware version directly fromthe Fourier Systems Download Center.2. Uptodata downloads the firmware file, namedFirmware.dfw, to the <strong>DaqLink</strong> directory on the PC. Thedefault path is: C:\Program Files\FourierSystems\<strong>DaqLink</strong>.If you download the firmware file from the FourierSystems Download Center make sure to copy the file tothe same path listed above.107
Once the file is downloaded the next step is to update the<strong>DaqLink</strong> units.5.2.2. Firmware Update from the MapView IconThe <strong>DaqLink</strong> data logger has the Update Firmware option inits Map View icon context menu.1. To perform a direct update from a specific unit, open thecontext menu and select Update Firmware.2. Enter the password in the Password dialog box.3. A <strong>DaqLink</strong> system message will prompt you to confirm theupdate. Click Yes.4. The firmware will begin updating and you can monitor itsprogress in the unit’s tooltip.108
Appendix A:<strong>DaqLink</strong> SpecificationsA.1.Data Logger Input TypesDBSA710 and DBSA720External InputsFour external inputs with selectablesensor type for each input:• 4 to 20 mA• 0 to 1 V• 0 to 50 mV• PT-100 (2-wire)• Contact (Open/Closed)• Thermocouple J, K or T• Pulse counter (Input 4 only)• Frequency (Input 4 only)• <strong>User</strong>-defined sensorsInternal InputsDBSA710• PT-100 TemperatureDBSA720• Digital Temperature• Digital Relative Humidity109
A.2.DBSA710 and DBSA720OutputsAlarm Output (Output 1)Open collectorClose position resistance: 50 ΩMax. Load: 50 mA, 3 V DCOverload protection50 mA reset fuseExternal Power Excitation(transducers usage)12 VDC @ 2 AA.3.Logger InputSpecifications DBSA710and DBSA720Internal PT-100Temperature(DBSA710)Type: PT-100Range: -20 to 50 ˚CResolution: 0.1 ˚CAccuracy: ±0.3 ˚CInternal DigitalTemperature(DBSA720)Type: Digital sensorRange: -20 to 50 ˚CResolution: 0.1 ˚CAccuracy: ±0.5 ˚CInternal DigitalRelative Humidity(DBSA720)Range: 5 to 95 %Resolution: 0.5%Accuracy:3% (<strong>DaqLink</strong> software)4% (Logger LCD)110
TemperatureThermocouple JRange: -200 to 1,000 ˚CResolution: 0.1 ˚CAccuracy:-200 to – 60 ˚C ±0.5 %-60 to 60 ˚C ±0.5 ˚C60 to 1,000 ˚C ±0.5 %Cold junctioncompensation: ±0.3 ˚CTemperature PT-100(2-wire)TemperatureThermocouple KRange: -200 to 1,000 ˚CResolution: 0.1 ˚CAccuracy:-200 to – 60 ˚C ±0.5 %-60 to 60 ˚C ±0.5 ˚C60 to 1,000 ˚C ±0.5 %Cold junctioncompensation: ±0.3 ˚CPulse Counter(Input 4 only)TemperatureThermocouple TRange: -200 to 400 ˚CResolution: 0.1 ˚CAccuracy:-200 to – 60 ˚C ±0.5 %-60 to 60 ˚C ±0.5 ˚C60 to 400 ˚C ±0.5 %Cold junctioncompensation: ±0.3 ˚CFrequency(Input 4 only)Range: -200 to 400 ˚CResolution: 0.1 ˚C)Accuracy:-200 to - 60 ˚C ±0.5 %Zero crossing detectorRange: 1 to 65,536countsResolution: 1 countZero crossing detectorRange: 20 Hz to 4 KHzInput signal: 0 to 5 VInput impedance: 470 Ω-60 to 60 ˚C ±0.3 ˚C 60 toFrequency range: 0 to 4400 ˚C ±0.5 %KHzInput signal: 0 to 5 VInput impedance: 470 Ω4 to 20 mA 0 to 1 V 0 to 50 mVRange: 4 to 20 mAResolution: 4.76 μAAccuracy: ±0.5 %Loop impedance: 21 ΩMaximum load: 30 mA,5.2 VRange: 0 to 1 VResolution: 200 μVAccuracy: ±0.5 %Input impedance: 25MΩMaximum voltage: 5.2 VRange: 0 to 50 mVResolution: 3 μVAccuracy: ±0.5 %Input impedance: 25MΩMaximum voltage: 5.2 V111
ContactRange: Open/CloseA.4.General Specifications<strong>DaqLink</strong> Logger Sampling Features• Memory capacity: ~59,000 samples• Sampling rate: Once per sec to once every 18 hours• Sampling resolution: 16-bit• Channel separation: 80 dBDBSA710 and DBSA720 HardwareSpecificationsDisplay• 2-row LCD• 16 character displayPower Supply• Battery:• Internal rechargeable 4.8 V, 800 mAh NiMH battery(2 batteries in series)• Built-in battery charger• Battery Life: Up to six months depending on loggerconfiguration• AC Power:• External 12 V DC input @ 300 mA 3.6 VA• Center Negative112
Alarm Output• Open collector• Close position resistance: 50 Ω• Max. Load: 50 mA, 3 V DC• Overload protection• 50mA reset fuseOperating Temperature Range• -20 to 50 ˚C• Water and dust proof: IP54Man Machine InterfaceFull keyboard operationStandards ComplianceCE, FCCA.5. System RequirementsSoftwareOS Platform: Windows 2000 SP3,Windows 2003, Windows XP SP2, andWindows VistaBrowser: Internet Explorer 5.01 orhigherScreen Resolution: Minimum 1024 x768HardwareProcessor: Pentium 800 MHz orhigherMemory: 256 MB RAMStorage Memory: 250 MB availabledisk space for the <strong>DaqLink</strong> application113
Appendix B:Safety InformationThe <strong>DaqLink</strong> system complies with relevant safety regulationsfor data processing devices. Please contact Fourier Systemswith any questions regarding <strong>DaqLink</strong> safety issues.<strong>DaqLink</strong> BatteryThe <strong>DaqLink</strong> DBSA710 and DBSA720 devices are suppliedwith internal rechargeable 4.8 V NiMH batteries as well asconnection to AC power.• Do not tamper or drop the battery to avoid leakage ofhazardous chemicals contained within.• Do not puncture, incinerate, disassemble or expose thebattery to temperatures above 122 ºF (50 ºC).• Keep the battery away from children.• Dispose of the battery only in accordance with localregulations concerning potentially hazardous waste. Donot throw in the garbage bin.• Remove the battery when not using the <strong>DaqLink</strong> loggersfor a significant period of time e.g. when the <strong>DaqLink</strong>loggers are placed in long-term storage.<strong>DaqLink</strong> AC Power Adapter• Only use the AC adapter provided by Fourier Systems.• Verify that your power outlet is suitable for the voltage ofthe AC adapter.114
• If the AC adapter is connected to an AC outlet, make surethe area around the outlet is accessible and the adapter isnot covered while in operation.• Do not place the AC adapter on heat-sensitive material.• Do not charge the <strong>DaqLink</strong> while situated in a carryingcase or without sufficient airflow surrounding the loggers.• Do not expose the adapter to direct sunlight or water.• Do not tamper with the adapter components.<strong>DaqLink</strong> Operating EnvironmentDBSA710 and DBSA720: -20 to 50 ˚C115
Appendix C:Ordering InformationFor the full list of <strong>DaqLink</strong> products, and place <strong>DaqLink</strong> ordersplease visit www.fouriersystems.com/order or contact yourlocal Fourier distributor:<strong>DaqLink</strong> Product SuitePart Number Product Name Product DescriptionDBSA710DBSA720DQL-PCSUITEData LoggerData LoggerSoftware CD andAccessoriesInternal Temperature PT-100sensorFour channels: mA, V, mV, TC-K/J/T, PT-100, Pulse,Frequency, ContactInternal Digital RH andTemperature sensorsFour channels: mA, V, mV, TC-K/J/T, PT-100, Pulse,Frequency, ContactPC Suite including USBcommunication cable, softwareCD and digital user guide116
Part Number Product Name Product Description12504 GSM Modem GSM modem connecting to PCand integrates with <strong>DaqLink</strong>software to enable sending ofSMS alarm notifications12753 PT-100 temperaturesensor and cable12752 PT-100 temperaturesensor and cable12751 PT-100 temperaturesensor and cable12655 1 m mini-USBcommunication cablePT-100 temperature sensor• Range: -70 to 400 °C• 2.5 m cable lengthPT-100 temperature sensor• Range: -70 to 400 °C• 4 m cable lengthPT-100 temperature sensor• Range: -70 to 400 °C• 6 m cable lengthFor connection between loggerand PC13330 3 m mini-USBcommunication cableFor connection between loggerand PC117
Appendix D:Figures and TablesList of FiguresFIGURE 1: MAIN DAQLINK WINDOW 7FIGURE 2: ADDING DATA LOGGER ICON TO MAP VIEW 9FIGURE 3: LOGGER SETUP WINDOW 11FIGURE 4: ONLINE DATA – GRAPH VIEW 14FIGURE 5: ONLINE DATA – TABLE VIEW 14FIGURE 6: ONLINE DATA – STATISTICS VIEW 14FIGURE 7: LOGGER TOOLTIP 15FIGURE 8: SENSOR VIEW 15FIGURE 9: DBSA710 DATA LOGGER FRONT PANEL 17FIGURE 10: DBSA720 DATA LOGGER EXTERNALCONNECTIONS 18FIGURE 11: DAQLINK LOGGER SENSOR INPUTS 21FIGURE 12: EXTERNAL ALARM SCHEMATIC 24FIGURE 13: USB COMMUNICATION CABLE 30FIGURE 14: INSTALLING SILICON LABS USB DRIVER –STEP 1 40FIGURE 15: INSTALLING SILICON LABS USB DRIVER –STEP 2 40FIGURE 16: INSTALLING SILICON LABS USB DRIVER –STEP 3 41FIGURE 17: INSTALLING SILICON LABS USB DRIVER –STEP 4 41FIGURE 18: MAIN WINDOW - MAP VIEW 43FIGURE 19: MAIN WINDOW – SENSOR DATA IN MAPVIEW 44FIGURE 20: MAIN WINDOW – HISTORY VIEW 45FIGURE 21: DATA MAP 47FIGURE 22: MAIN TOOLBAR ICONS 47FIGURE 23: DEFINE NEW SENSOR DIALOG 56118
FIGURE 24: OPTIONS > PREFERENCES TAB 58FIGURE 25: OPTIONS > EMAIL SETTINGS TAB 61FIGURE 26: OPTIONS > SMS SETTINGS TAB 62FIGURE 27: OPEN DATA FILES DIALOG 65FIGURE 28: SYNC DATA DIALOG 66FIGURE 29: ONLINE DATA WINDOW 67FIGURE 30: ALARM SETUP TAB 77FIGURE 31: ALARM NOTIFICATIONS SETUP DIALOG 79FIGURE 32: ADDING A CONTACT 80FIGURE 33: ADDING A GROUP 82FIGURE 34: CALIBRATION DIALOG 88FIGURE 35: TWO-POINT CALIBRATION WINDOW 90FIGURE 36: EXAMPLE OF USING TWO CURSORS 95FIGURE 37: GRAPH WITH GRID IN BACKGROUND 96FIGURE 38: GROUPING PLOTS BY UNITS 99FIGURE 39: STATISTICS VIEW 100FIGURE 40: EXAMPLE OF DATA EXPORTED TO EXCEL101FIGURE 41: PRINTING A TABLE 102FIGURE 42: UPTODATA DIALOG 105FIGURE 43: UPTODATA CONFIGURATION DIALOG 106List of TablesTABLE 1: DATA LOGGER PROGRAMMING LIMITATIONS 23TABLE 2: MAIN TOOLBAR ICON LIST 48TABLE 3: MAIN TOOLBAR ICON LIST 50TABLE 4: LOWER GRAPH TOOLBAR ICON LIST 51TABLE 5: DATA MAP ICONS 52119
120