

Annual Report 1999 - Skanska
Annual Report 1999 - Skanska
Annual Report 1999 - Skanska

You also want an ePaper? Increase the reach of your titles
YUMPU automatically turns print PDFs into web optimized ePapers that Google loves.
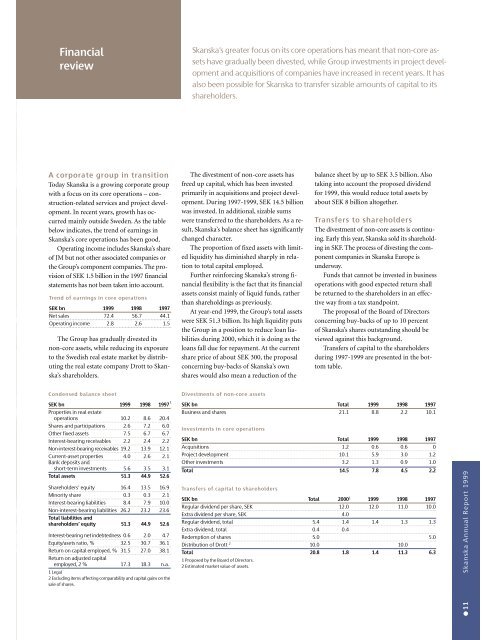
Financialreview<strong>Skanska</strong>’s greater focus on its core operations has meant that non-core assetshave gradually been divested, while Group investments in project developmentand acquisitions of companies have increased in recent years. It hasalso been possible for <strong>Skanska</strong> to transfer sizable amounts of capital to itsshareholders.A corporate group in transitionToday <strong>Skanska</strong> is a growing corporate groupwith a focus on its core operations – construction-relatedservices and project development.In recent years, growth has occurredmainly outside Sweden. As the tablebelow indicates, the trend of earnings in<strong>Skanska</strong>’s core operations has been good.Operating income includes <strong>Skanska</strong>’s shareof JM but not other associated companies orthe Group’s component companies. The provisionof SEK 1.5 billion in the 1997 financialstatements has not been taken into account.Trend of earnings in core operationsSEK bn <strong>1999</strong> 1998 1997Net sales 72.4 56.7 44.1Operating income 2.8 2.6 1.5The Group has gradually divested itsnon-core assets, while reducing its exposureto the Swedish real estate market by distributingthe real estate company Drott to <strong>Skanska</strong>’sshareholders.The divestment of non-core assets hasfreed up capital, which has been investedprimarily in acquisitions and project development.During 1997-<strong>1999</strong>, SEK 14.5 billionwas invested. In additional, sizable sumswere transferred to the shareholders. As a result,<strong>Skanska</strong>’s balance sheet has significantlychanged character.The proportion of fixed assets with limitedliquidity has diminished sharply in relationto total capital employed.Further reinforcing <strong>Skanska</strong>’s strong financialflexibility is the fact that its financialassets consist mainly of liquid funds, ratherthan shareholdings as previously.At year-end <strong>1999</strong>, the Group’s total assetswere SEK 51.3 billion. Its high liquidity putsthe Group in a position to reduce loan liabilitiesduring 2000, which it is doing as theloans fall due for repayment. At the currentshare price of about SEK 300, the proposalconcerning buy-backs of <strong>Skanska</strong>’s ownshares would also mean a reduction of thebalance sheet by up to SEK 3.5 billion. Alsotaking into account the proposed dividendfor <strong>1999</strong>, this would reduce total assets byabout SEK 8 billion altogether.Transfers to shareholdersThe divestment of non-core assets is continuing.Early this year, <strong>Skanska</strong> sold its shareholdingin SKF. The process of divesting the componentcompanies in <strong>Skanska</strong> Europe isunderway.Funds that cannot be invested in businessoperations with good expected return shallbe returned to the shareholders in an effectiveway from a tax standpoint.The proposal of the Board of Directorsconcerning buy-backs of up to 10 percentof <strong>Skanska</strong>’s shares outstanding should beviewed against this background.Transfers of capital to the shareholdersduring 1997-<strong>1999</strong> are presented in the bottomtable.Condensed balance sheetSEK bn <strong>1999</strong> 1998 1997Properties in real estateoperations 10.2 8.6 20.4Shares and participations 2.6 7.2 6.0Other fixed assets 7.5 6.7 6.7Interest-bearing receivables 2.2 2.4 2.2Non-interest-bearing receivables 19.2 13.9 12.1Current-asset properties 4.0 2.6 2.1Bank deposits andshort-term investments 5.6 3.5 3.1Total assets 51.3 44.9 52.6Shareholders’ equity 16.4 13.5 16.9Minority share 0.3 0.3 2.1Interest-bearing liabilities 8.4 7.9 10.0Non-interest-bearing liabilities 26.2 23.2 23.6Total liabilities andshareholders’ equity 51.3 44.9 52.6Interest-bearing net indebtedness 0.6 2.0 4.7Equity/asets ratio, % 32.5 30.7 36.1Return on capital employed, % 31.5 27.0 38.1Return on adjusted capitalemployed, 2 % 17.3 18.3 n.a.1 Legal2 Excluding items affecting comparability and capital gains on thesale of shares.1Divestments of non-core assetsSEK bn Total <strong>1999</strong> 1998 1997Business and shares 21.1 8.8 2.2 10.1Investments in core operationsSEK bn Total <strong>1999</strong> 1998 1997Acquisitions 1.2 0.6 0.6 0Project development 10.1 5.9 3.0 1.2Other investments 3.2 1.3 0.9 1.0Total 14.5 7.8 4.5 2.2Transfers of capital to shareholdersSEK bn Total 2000 1 <strong>1999</strong> 1998 1997Regular dividend per share, SEK 12.0 12.0 11.0 10.0Extra dividend per share, SEK 4.0Regular dividend, total 5.4 1.4 1.4 1.3 1.3Extra dividend, total 0.4 0.4Redemption of shares 5.0 5.0Distribution of Drott 2 10.0 10.0Total 20.8 1.8 1.4 11.3 6.31 Proposed by the Board of Directors.2 Estimated market value of assets.● 11 <strong>Skanska</strong> <strong>Annual</strong> <strong>Report</strong> <strong>1999</strong>


